Estimated Value: $646,000 - $663,000
4
Beds
3
Baths
3,261
Sq Ft
$200/Sq Ft
Est. Value
About This Home
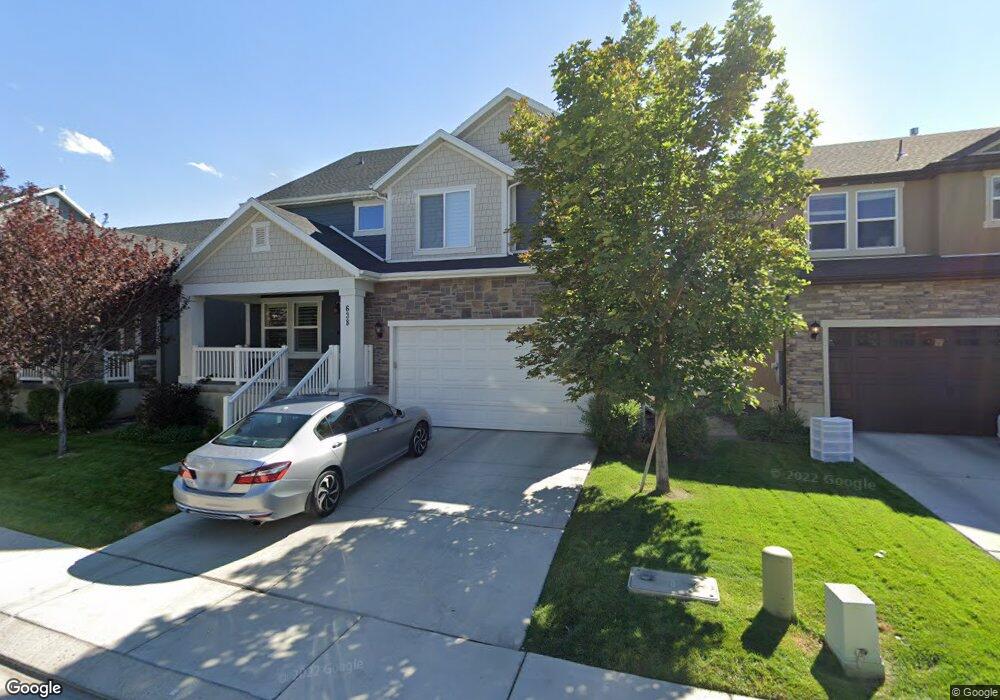
This home is located at 638 E 320 S Unit 7, Lehi, UT 84043 and is currently estimated at $652,522, approximately $200 per square foot. 638 E 320 S Unit 7 is a home located in Utah County with nearby schools including Meadow Elementary School, Lehi Junior High School, and Lehi High School.
Ownership History
Date
Name
Owned For
Owner Type
Purchase Details
Closed on
Nov 3, 2020
Sold by
Lynch Patrick and Lynch Christina
Bought by
Loveland Steven V and Varner Bridget V
Current Estimated Value
Home Financials for this Owner
Home Financials are based on the most recent Mortgage that was taken out on this home.
Original Mortgage
$430,350
Outstanding Balance
$382,950
Interest Rate
2.8%
Mortgage Type
New Conventional
Estimated Equity
$269,572
Purchase Details
Closed on
Mar 20, 2014
Sold by
Edge Land 12 Llc
Bought by
Lynch Patrick and Lynch Christina
Home Financials for this Owner
Home Financials are based on the most recent Mortgage that was taken out on this home.
Original Mortgage
$293,072
Interest Rate
3.87%
Mortgage Type
FHA
Create a Home Valuation Report for This Property
The Home Valuation Report is an in-depth analysis detailing your home's value as well as a comparison with similar homes in the area
Home Values in the Area
Average Home Value in this Area
Purchase History
| Date | Buyer | Sale Price | Title Company |
|---|---|---|---|
| Loveland Steven V | -- | Backman Title Services | |
| Lynch Patrick | -- | Affiliated First Title Co |
Source: Public Records
Mortgage History
| Date | Status | Borrower | Loan Amount |
|---|---|---|---|
| Open | Loveland Steven V | $430,350 | |
| Previous Owner | Lynch Patrick | $293,072 |
Source: Public Records
Tax History Compared to Growth
Tax History
| Year | Tax Paid | Tax Assessment Tax Assessment Total Assessment is a certain percentage of the fair market value that is determined by local assessors to be the total taxable value of land and additions on the property. | Land | Improvement |
|---|---|---|---|---|
| 2025 | $2,638 | $345,785 | $227,100 | $401,600 |
| 2024 | $2,638 | $308,715 | $0 | $0 |
| 2023 | $2,462 | $312,840 | $0 | $0 |
| 2022 | $2,679 | $330,000 | $0 | $0 |
| 2021 | $2,412 | $449,100 | $131,400 | $317,700 |
| 2020 | $2,274 | $418,600 | $121,700 | $296,900 |
| 2019 | $2,031 | $388,700 | $121,700 | $267,000 |
| 2018 | $1,978 | $357,800 | $112,600 | $245,200 |
| 2017 | $1,903 | $182,985 | $0 | $0 |
| 2016 | $1,938 | $172,920 | $0 | $0 |
| 2015 | $2,002 | $169,565 | $0 | $0 |
| 2014 | $642 | $54,100 | $0 | $0 |
Source: Public Records
Map
Nearby Homes
- 638 E 320 S
- 644 E 320 S
- 634 E 320 S Unit 8
- 664 E 320 S Unit 66
- 641 E 320 S Unit 5
- 635 E 320 S Unit 4
- 657 E 320 S Unit 31
- 631 E 320 S Unit 3
- 682 E 320 S Unit 65
- 682 E 320 S
- 328 S 630 E Unit 2
- 346 S 630 E Unit 1
- 671 E 320 S Unit 32
- 671 E 320 S
- 696 E 320 S Unit 64
- 696 E 320 S
- 352 S 630 E Unit 30
- 689 E 320 S Unit 33
- 639 E 380 S
- 639 E 380 S Unit 10