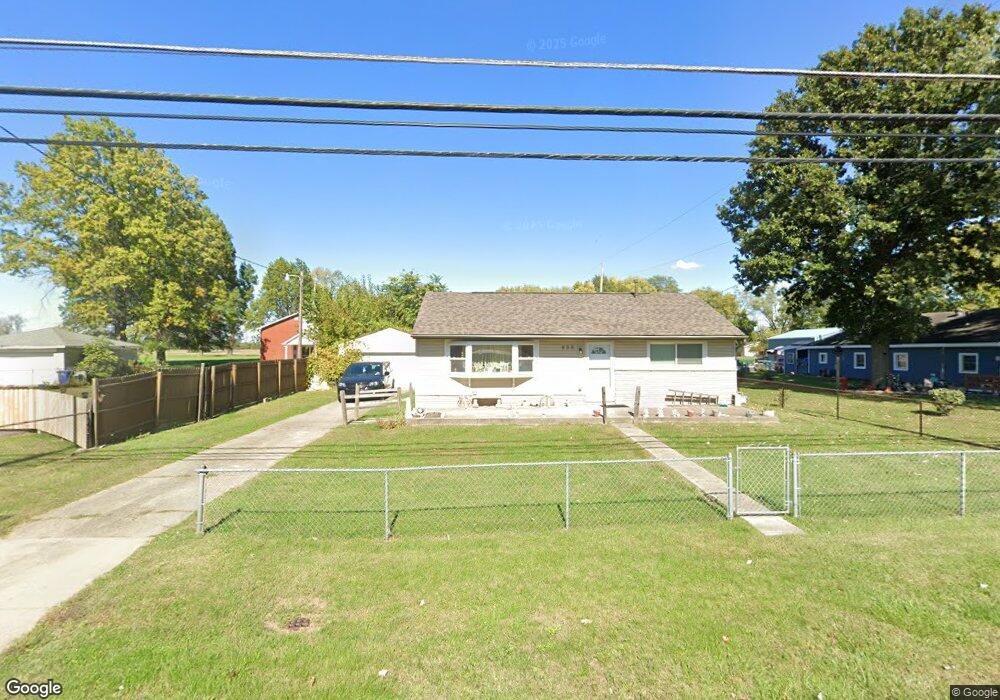
638 Hilock Rd Columbus, OH 43207
Obetz-Lockbourne NeighborhoodEstimated Value: $155,000 - $163,000
3
Beds
1
Bath
864
Sq Ft
$184/Sq Ft
Est. Value
About This Home
This home is located at 638 Hilock Rd, Columbus, OH 43207 and is currently estimated at $159,319, approximately $184 per square foot. 638 Hilock Rd is a home located in Franklin County with nearby schools including Parsons Elementary School, Buckeye Middle School, and Marion-Franklin High School.
Ownership History
Date
Name
Owned For
Owner Type
Purchase Details
Closed on
Sep 11, 2007
Sold by
Novastar Mortgage Inc
Bought by
Gatewood Happy W and Gatewood Mary L
Current Estimated Value
Home Financials for this Owner
Home Financials are based on the most recent Mortgage that was taken out on this home.
Original Mortgage
$34,400
Outstanding Balance
$21,757
Interest Rate
6.55%
Mortgage Type
Purchase Money Mortgage
Estimated Equity
$137,562
Purchase Details
Closed on
Jun 14, 2007
Sold by
Crisp Richard D and Case #06Cve12 16458
Bought by
Novastar Mortgage Inc
Purchase Details
Closed on
Oct 3, 1994
Sold by
Reeder Creola M
Bought by
Crisp Richard D and Crisp Tammie S
Purchase Details
Closed on
Oct 5, 1989
Purchase Details
Closed on
Feb 17, 1988
Create a Home Valuation Report for This Property
The Home Valuation Report is an in-depth analysis detailing your home's value as well as a comparison with similar homes in the area
Home Values in the Area
Average Home Value in this Area
Purchase History
| Date | Buyer | Sale Price | Title Company |
|---|---|---|---|
| Gatewood Happy W | $43,000 | Fidelity Land Title Agency | |
| Novastar Mortgage Inc | $44,000 | None Available | |
| Crisp Richard D | $53,563 | -- | |
| -- | $42,000 | -- | |
| -- | -- | -- |
Source: Public Records
Mortgage History
| Date | Status | Borrower | Loan Amount |
|---|---|---|---|
| Open | Gatewood Happy W | $34,400 |
Source: Public Records
Tax History Compared to Growth
Tax History
| Year | Tax Paid | Tax Assessment Tax Assessment Total Assessment is a certain percentage of the fair market value that is determined by local assessors to be the total taxable value of land and additions on the property. | Land | Improvement |
|---|---|---|---|---|
| 2024 | $1,924 | $52,680 | $16,700 | $35,980 |
| 2023 | $1,928 | $52,675 | $16,695 | $35,980 |
| 2022 | $1,048 | $28,950 | $11,590 | $17,360 |
| 2021 | $1,050 | $28,950 | $11,590 | $17,360 |
| 2020 | $1,051 | $28,950 | $11,590 | $17,360 |
| 2019 | $1,022 | $25,590 | $10,080 | $15,510 |
| 2018 | $715 | $25,590 | $10,080 | $15,510 |
| 2017 | $737 | $25,590 | $10,080 | $15,510 |
| 2016 | $452 | $15,580 | $2,940 | $12,640 |
| 2015 | $411 | $15,580 | $2,940 | $12,640 |
| 2014 | $412 | $15,580 | $2,940 | $12,640 |
| 2013 | $227 | $16,380 | $3,080 | $13,300 |
Source: Public Records
Map
Nearby Homes
- 3302 Hilock Place
- 860 Basswood Rd
- 1633-1635 E Greenway Ave
- 884 Bruckner Rd
- 696 Williams Rd
- 3161 Lewis Rd
- 0 Williams Rd
- 1138 Hilock Rd
- 1138 Hilock Rd Unit 35
- 1124 Rumsey Rd
- 3380 Parsons Ave
- 3414 Parsons Ave
- 1085 Williams Rd
- 3573 S Champion Ave
- 256 Rumsey Rd Unit 258
- 228 Currier Dr
- 2901 Parsons Ave
- 3691 Abney Rd
- 1118 Maplewood Rd
- 202 Williams Rd