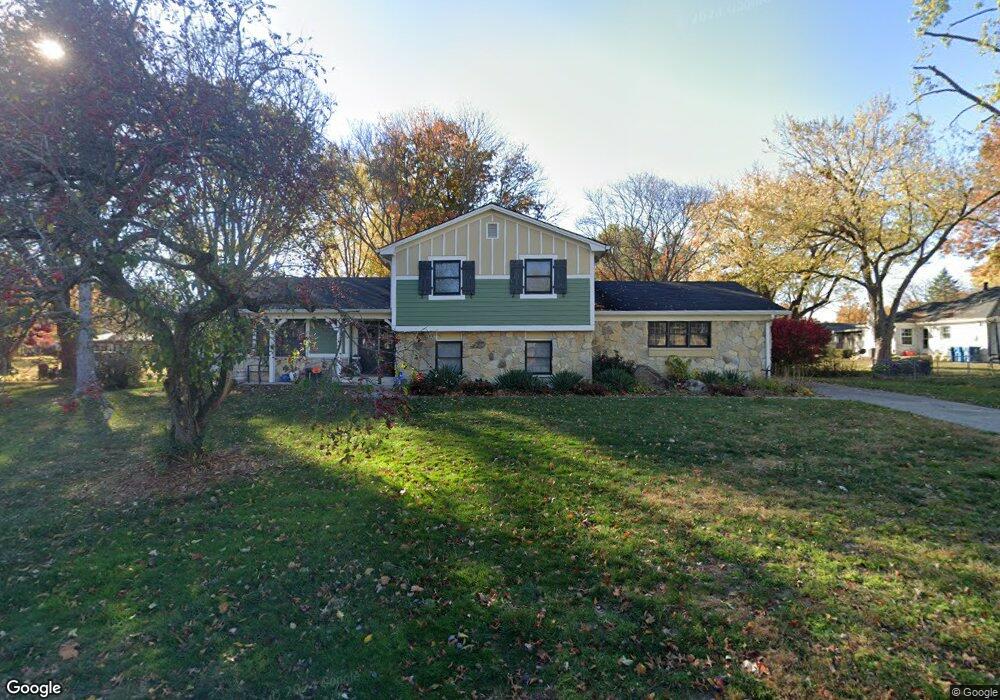
638 Mulford Ct Indianapolis, IN 46234
Chapel Hill-Ben Davis NeighborhoodEstimated Value: $289,038 - $325,000
3
Beds
2
Baths
2,006
Sq Ft
$155/Sq Ft
Est. Value
About This Home
This home is located at 638 Mulford Ct, Indianapolis, IN 46234 and is currently estimated at $311,010, approximately $155 per square foot. 638 Mulford Ct is a home located in Marion County with nearby schools including Chapel Glen Elementary School, Chapel Hill 7th & 8th Grade Center, and Ben Davis High School.
Ownership History
Date
Name
Owned For
Owner Type
Purchase Details
Closed on
Mar 9, 2010
Sold by
Lindgren Leonard C
Bought by
Ray Courtney L
Current Estimated Value
Home Financials for this Owner
Home Financials are based on the most recent Mortgage that was taken out on this home.
Original Mortgage
$136,972
Interest Rate
5.25%
Mortgage Type
FHA
Purchase Details
Closed on
Jan 15, 2010
Sold by
Lindgren Leonard C and Lindgren Revocable T Leonard C
Bought by
Ray Courtney L
Home Financials for this Owner
Home Financials are based on the most recent Mortgage that was taken out on this home.
Original Mortgage
$136,972
Interest Rate
5.25%
Mortgage Type
FHA
Create a Home Valuation Report for This Property
The Home Valuation Report is an in-depth analysis detailing your home's value as well as a comparison with similar homes in the area
Home Values in the Area
Average Home Value in this Area
Purchase History
| Date | Buyer | Sale Price | Title Company |
|---|---|---|---|
| Ray Courtney L | -- | None Available | |
| Ray Courtney L | -- | None Available |
Source: Public Records
Mortgage History
| Date | Status | Borrower | Loan Amount |
|---|---|---|---|
| Previous Owner | Ray Courtney L | $136,972 |
Source: Public Records
Tax History Compared to Growth
Tax History
| Year | Tax Paid | Tax Assessment Tax Assessment Total Assessment is a certain percentage of the fair market value that is determined by local assessors to be the total taxable value of land and additions on the property. | Land | Improvement |
|---|---|---|---|---|
| 2024 | $2,964 | $246,700 | $30,700 | $216,000 |
| 2023 | $2,964 | $243,000 | $30,700 | $212,300 |
| 2022 | $2,796 | $226,200 | $30,700 | $195,500 |
| 2021 | $2,653 | $188,200 | $30,700 | $157,500 |
| 2020 | $2,554 | $181,600 | $30,700 | $150,900 |
| 2019 | $2,469 | $176,000 | $30,700 | $145,300 |
| 2018 | $2,110 | $171,300 | $30,700 | $140,600 |
| 2017 | $2,026 | $164,700 | $30,700 | $134,000 |
| 2016 | $1,791 | $145,800 | $30,700 | $115,100 |
| 2014 | $1,464 | $146,400 | $30,700 | $115,700 |
| 2013 | $1,351 | $135,100 | $30,700 | $104,400 |
Source: Public Records
Map
Nearby Homes
- 8539 Chapel Pines Dr
- 8409 Chapel Pines Dr
- 821 Chapel Pines Dr W
- 918 Ardsley Dr
- 839 Fernwood Ct
- 810 Kendale Ct
- 8729 Chapel Glen Dr
- 390 Nottinghill Ct
- 8840 Ellington Dr
- 8443 Nottinghill Dr
- 1210 Country Creek Ct
- 1255 Country Ridge Ln
- 1357 Country Ridge Ln
- 9230 W 10th St
- 9138 Broken Arrow Rd
- 9218 Wind River Ct Unit 4155
- 263 N Raceway Rd
- 718 Bradford Cir
- 7506 Radburn Cir
- 1270 Valley Forge Dr
- 632 Mulford Ct
- 639 Folcroft Ct
- 8519 Warrington Dr
- 648 Mulford Ct
- 629 Folcroft Ct
- 649 Folcroft Ct
- 631 Mulford Ct
- 627 Folcroft Ct
- 637 Mulford Ct
- 621 Folcroft Ct
- 640 Folcroft Ct
- 8433 Warrington Dr
- 630 Folcroft Ct
- 648 Folcroft Ct
- 8520 Warrington Dr
- 8510 Warrington Dr
- 8450 Warrington Dr
- 8530 Warrington Dr
- 620 Folcroft Ct
- 640 Rayham Ct