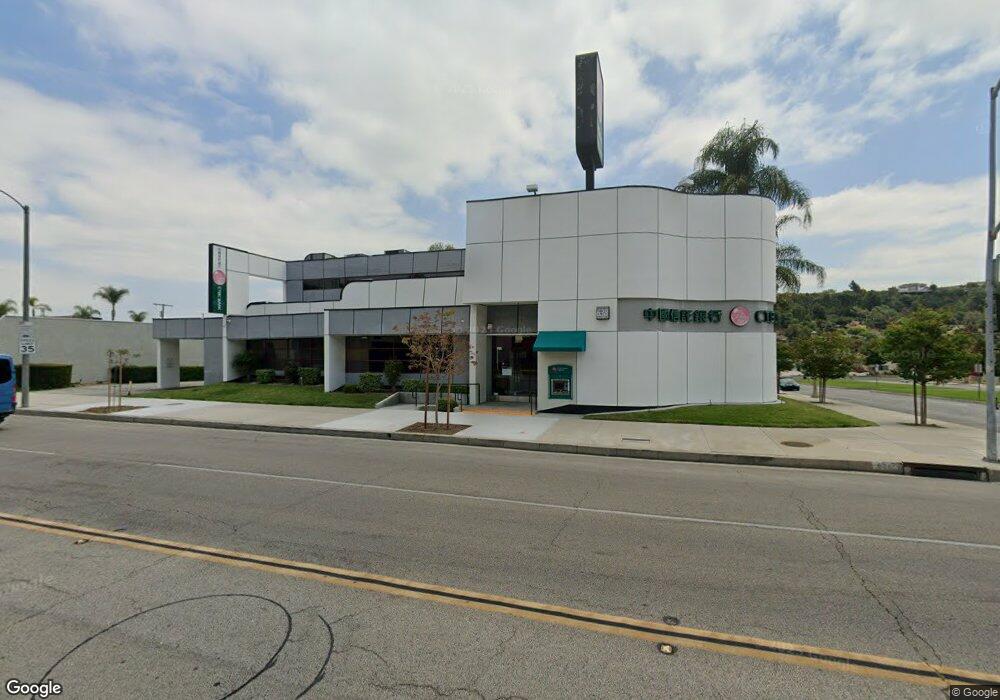
638 S Atlantic Blvd Monterey Park, CA 91754
Estimated Value: $8,128,202
--
Bed
--
Bath
8,324
Sq Ft
$976/Sq Ft
Est. Value
About This Home
This home is located at 638 S Atlantic Blvd, Monterey Park, CA 91754 and is currently estimated at $8,128,202, approximately $976 per square foot. 638 S Atlantic Blvd is a home located in Los Angeles County with nearby schools including Brightwood Elementary School, Mark Keppel High School, and St. Stephen Martyr School.
Ownership History
Date
Name
Owned For
Owner Type
Purchase Details
Closed on
Jan 30, 2008
Sold by
Pinetree Enterprises Inc
Bought by
B-K Monterey Park Property Llc
Current Estimated Value
Purchase Details
Closed on
Feb 10, 2005
Sold by
Pont Inc
Bought by
Pinetree Enterprise Inc
Home Financials for this Owner
Home Financials are based on the most recent Mortgage that was taken out on this home.
Original Mortgage
$2,090,000
Interest Rate
5.48%
Mortgage Type
Commercial
Create a Home Valuation Report for This Property
The Home Valuation Report is an in-depth analysis detailing your home's value as well as a comparison with similar homes in the area
Home Values in the Area
Average Home Value in this Area
Purchase History
| Date | Buyer | Sale Price | Title Company |
|---|---|---|---|
| B-K Monterey Park Property Llc | $4,350,000 | Commonwealth Land Title Co | |
| Pinetree Enterprise Inc | $2,991,000 | Ticor Title Co |
Source: Public Records
Mortgage History
| Date | Status | Borrower | Loan Amount |
|---|---|---|---|
| Previous Owner | Pinetree Enterprise Inc | $2,090,000 |
Source: Public Records
Tax History Compared to Growth
Tax History
| Year | Tax Paid | Tax Assessment Tax Assessment Total Assessment is a certain percentage of the fair market value that is determined by local assessors to be the total taxable value of land and additions on the property. | Land | Improvement |
|---|---|---|---|---|
| 2025 | $72,673 | $5,713,803 | $3,499,213 | $2,214,590 |
| 2024 | $72,673 | $5,601,768 | $3,430,601 | $2,171,167 |
| 2023 | $71,148 | $5,491,931 | $3,363,335 | $2,128,596 |
| 2022 | $67,723 | $5,384,247 | $3,297,388 | $2,086,859 |
| 2021 | $66,961 | $5,278,675 | $3,232,734 | $2,045,941 |
| 2019 | $64,538 | $5,122,108 | $3,136,850 | $1,985,258 |
| 2018 | $64,750 | $5,021,676 | $3,075,344 | $1,946,332 |
| 2016 | $59,662 | $4,826,680 | $2,955,926 | $1,870,754 |
| 2015 | $58,733 | $4,754,180 | $2,911,526 | $1,842,654 |
| 2014 | $57,847 | $4,661,053 | $2,854,494 | $1,806,559 |
Source: Public Records
Map
Nearby Homes
- 408 De la Fuente St
- 824 De la Fuente St
- 419 S Chandler Ave Unit 521
- 1141 Williams St
- 311 Montechico Dr
- 1027 De la Fuente St
- 701 S Garfield Ave
- 1240 S Ynez Ave
- 1100 S Grandridge Ave
- 259 Fremont Ave
- 125 S Moore Ave Unit 2
- 1351 S Ynez Ave
- 1301 S Atlantic Blvd Unit 234C
- 0 Garvey Ave Unit MB21123625
- 863 S Lincoln Ave
- 2656 Whitney Dr
- 421 S Garfield Ave Unit 79
- 411 S Garfield Ave
- 1701 S Mcpherrin Ave
- 1001 Abajo Dr
- 618 S Atlantic Blvd
- 616 S Atlantic Blvd
- 643 El Mercado Ave
- 637 El Mercado Ave
- 788 S Atlantic Blvd Unit 201 & 202
- 788 S Atlantic Blvd
- 633 El Mercado Ave
- 631 S Atlantic Blvd
- 629 El Mercado Ave
- 605 S Atlantic Blvd
- 728 S Atlantic Blvd
- 728 S Atlantic Blvd Unit 107
- 728 S Atlantic Blvd Unit 106
- 625 El Mercado Ave
- 601 S Atlantic Blvd
- 601 S Atlantic Blvd Unit 601
- 621 El Mercado Ave
- 701 El Mercado Ave
- 619 El Mercado Ave
- 638 El Mercado Ave