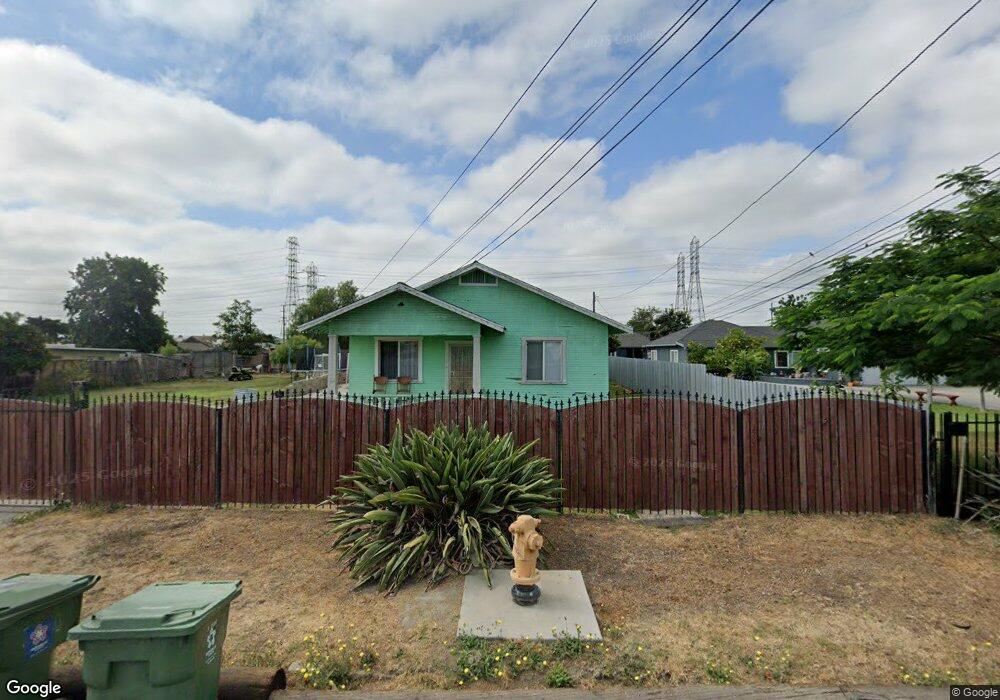
638 W Bennett St Compton, CA 90220
Estimated Value: $721,000 - $823,618
3
Beds
2
Baths
1,460
Sq Ft
$522/Sq Ft
Est. Value
About This Home
This home is located at 638 W Bennett St, Compton, CA 90220 and is currently estimated at $762,155, approximately $522 per square foot. 638 W Bennett St is a home located in Los Angeles County with nearby schools including Robert F. Kennedy Elementary School, Walton Middle School, and Compton High School.
Ownership History
Date
Name
Owned For
Owner Type
Purchase Details
Closed on
Jul 7, 2017
Sold by
Zepeda Mayra
Bought by
Zepeda Sergio
Current Estimated Value
Home Financials for this Owner
Home Financials are based on the most recent Mortgage that was taken out on this home.
Original Mortgage
$515,490
Interest Rate
4.12%
Mortgage Type
FHA
Purchase Details
Closed on
May 25, 2017
Sold by
Martin Tommy
Bought by
Zepeda Sergio and Martin Rigoberto
Home Financials for this Owner
Home Financials are based on the most recent Mortgage that was taken out on this home.
Original Mortgage
$515,490
Interest Rate
4.12%
Mortgage Type
FHA
Purchase Details
Closed on
May 22, 2013
Sold by
Martin Tommy
Bought by
Martin Tommy and Tommy Martin Sr Trust
Purchase Details
Closed on
Dec 18, 2006
Sold by
Martin Tommy
Bought by
Martin Tommy
Purchase Details
Closed on
Jun 2, 2000
Sold by
Martin Tommy
Bought by
Martin Tommy and Martin Marnita
Purchase Details
Closed on
May 23, 1997
Sold by
Martin Dorothy M
Bought by
Martin Tommy
Create a Home Valuation Report for This Property
The Home Valuation Report is an in-depth analysis detailing your home's value as well as a comparison with similar homes in the area
Home Values in the Area
Average Home Value in this Area
Purchase History
| Date | Buyer | Sale Price | Title Company |
|---|---|---|---|
| Zepeda Sergio | -- | Ticor Title | |
| Zepeda Sergio | $525,000 | Ticor Title | |
| Martin Tommy | -- | None Available | |
| Martin Tommy | -- | None Available | |
| Martin Tommy | -- | -- | |
| Martin Tommy | -- | -- |
Source: Public Records
Mortgage History
| Date | Status | Borrower | Loan Amount |
|---|---|---|---|
| Closed | Zepeda Sergio | $515,490 |
Source: Public Records
Tax History
| Year | Tax Paid | Tax Assessment Tax Assessment Total Assessment is a certain percentage of the fair market value that is determined by local assessors to be the total taxable value of land and additions on the property. | Land | Improvement |
|---|---|---|---|---|
| 2025 | $10,993 | $597,355 | $369,792 | $227,563 |
| 2024 | $10,993 | $585,643 | $362,542 | $223,101 |
| 2023 | $10,859 | $574,161 | $355,434 | $218,727 |
| 2022 | $9,937 | $562,904 | $348,465 | $214,439 |
| 2021 | $10,042 | $551,868 | $341,633 | $210,235 |
| 2019 | $9,761 | $535,500 | $331,500 | $204,000 |
| 2018 | $9,239 | $525,000 | $325,000 | $200,000 |
| 2016 | $4,702 | $248,828 | $92,797 | $156,031 |
| 2015 | $4,506 | $245,092 | $91,404 | $153,688 |
| 2014 | $4,440 | $240,292 | $89,614 | $150,678 |
Source: Public Records
Map
Nearby Homes
- 136 S Tulip Ave
- 1230 S Wilmington Ave
- 1210 S Grandee Ave
- 1307 S Grandee Ave
- 1201 S Grandee Ave
- 1412 S Northwood Ave
- 143 S Tulip Ave
- 945 W Dahlia St
- 1601 1603 W 165th St
- 147 S Tulip Ave
- 640 W Cypress St
- 1601 W 163rd St
- 1037 S Tajauta Ave
- 112 E Caldwell St
- 1619 W 163rd St
- 114 E Alondra Blvd
- 524 W Laurel St
- 426 W Laurel St
- 214 E Johnson St
- 310 S Paulsen Ave
- 700 W Bennett St
- 630 W Bennett St
- 706 W Bennett St
- 618 W Bennett St
- 635 W Greenleaf Blvd
- 631 W Greenleaf Blvd
- 710 W Bennett St
- 711 W Greenleaf Blvd
- 629 W Greenleaf Blvd
- 715 W Greenleaf Blvd
- 705 W Bennett St
- 614 W Bennett St
- 627 W Greenleaf Blvd
- 716 W Bennett St
- 713 W Bennett St
- 717 W Greenleaf Blvd
- 619 W Bennett St
- 617 W Greenleaf Blvd
- 643 W Bennett St
- 602 W Bennett St
Your Personal Tour Guide
Ask me questions while you tour the home.