6380 Raleigh St Unit 2103 Orlando, FL 32835
MetroWest NeighborhoodEstimated Value: $143,895 - $153,000
1
Bed
1
Bath
499
Sq Ft
$297/Sq Ft
Est. Value
About This Home
This home is located at 6380 Raleigh St Unit 2103, Orlando, FL 32835 and is currently estimated at $147,974, approximately $296 per square foot. 6380 Raleigh St Unit 2103 is a home located in Orange County with nearby schools including Westpointe Elementary, Chain of Lakes Middle School, and Olympia High.
Ownership History
Date
Name
Owned For
Owner Type
Purchase Details
Closed on
Dec 18, 2021
Sold by
Durgha David G
Bought by
David G Durgha Revocable Trust
Current Estimated Value
Purchase Details
Closed on
Jan 27, 2014
Sold by
Maharaj Sherrie Ann
Bought by
Durgha David
Purchase Details
Closed on
Apr 26, 2010
Sold by
Durgha Angelique
Bought by
Maharaj Sherrie Ann
Purchase Details
Closed on
May 13, 2009
Sold by
Durgha David G and Durgha Hardaye
Bought by
Durgha Angelique
Purchase Details
Closed on
Nov 17, 2006
Sold by
The Azur At Metrowest Llc
Bought by
Durgha David G and Durgha Hardaye
Home Financials for this Owner
Home Financials are based on the most recent Mortgage that was taken out on this home.
Original Mortgage
$112,955
Interest Rate
6.33%
Mortgage Type
Purchase Money Mortgage
Create a Home Valuation Report for This Property
The Home Valuation Report is an in-depth analysis detailing your home's value as well as a comparison with similar homes in the area
Home Values in the Area
Average Home Value in this Area
Purchase History
| Date | Buyer | Sale Price | Title Company |
|---|---|---|---|
| David G Durgha Revocable Trust | $100 | None Listed On Document | |
| Durgha David | -- | Attorney | |
| Maharaj Sherrie Ann | $25,000 | Gulfatlantic Title | |
| Durgha Angelique | -- | None Available | |
| Durgha David G | $118,900 | Multiple |
Source: Public Records
Mortgage History
| Date | Status | Borrower | Loan Amount |
|---|---|---|---|
| Previous Owner | Durgha David G | $112,955 |
Source: Public Records
Tax History Compared to Growth
Tax History
| Year | Tax Paid | Tax Assessment Tax Assessment Total Assessment is a certain percentage of the fair market value that is determined by local assessors to be the total taxable value of land and additions on the property. | Land | Improvement |
|---|---|---|---|---|
| 2025 | $1,849 | $109,661 | -- | -- |
| 2024 | $1,558 | $99,692 | -- | -- |
| 2023 | $1,558 | $87,300 | $17,460 | $69,840 |
| 2022 | $1,396 | $74,900 | $14,980 | $59,920 |
| 2021 | $1,276 | $74,900 | $14,980 | $59,920 |
| 2020 | $1,170 | $74,900 | $14,980 | $59,920 |
| 2019 | $1,089 | $62,400 | $12,480 | $49,920 |
| 2018 | $948 | $48,900 | $9,780 | $39,120 |
| 2017 | $862 | $42,900 | $8,580 | $34,320 |
| 2016 | $852 | $45,500 | $9,100 | $36,400 |
| 2015 | $746 | $35,400 | $7,080 | $28,320 |
| 2014 | $640 | $35,400 | $7,080 | $28,320 |
Source: Public Records
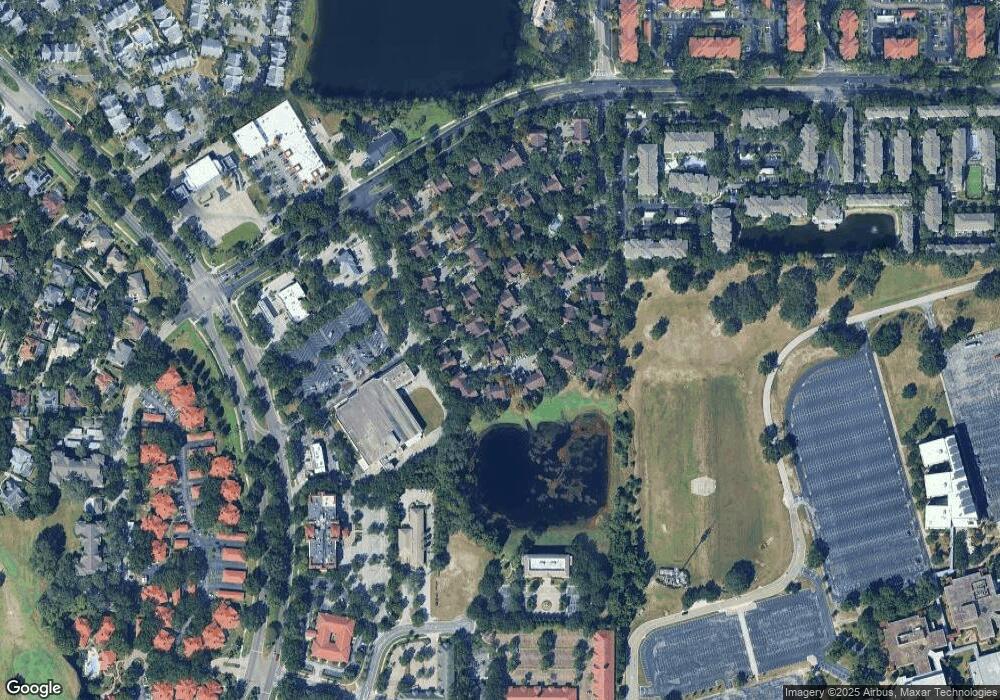
Map
Nearby Homes
- 6408 Raleigh St Unit 2403
- 6412 Raleigh St Unit 2504
- 6416 Raleigh St Unit 2614
- 6348 Raleigh St Unit 1311
- 6424 Raleigh St Unit 3114
- 6320 Raleigh St Unit 604
- 6324 Raleigh St Unit 712
- 6340 Raleigh St Unit 1011
- 6312 Raleigh St Unit 513
- 1079 S Hiawassee Rd Unit 1127
- 1081 S Hiawassee Rd Unit 723
- 1071 S Hiawassee Rd Unit 1214
- 1071 S Hiawassee Rd Unit 1213
- 1089 S Hiawassee Rd Unit 323
- 1083 S Hiawassee Rd Unit 635
- 1069 S Hiawassee Rd Unit 1317
- 1091 S Hiawassee Rd Unit 218
- 1091 S Hiawassee Rd Unit 216
- 1212 S Hiawassee Rd Unit 536
- 1057 S Hiawassee Rd Unit 1913
- 6380 Raleigh St Unit 2140
- 6380 Raleigh St Unit 2105
- 6380 Raleigh St Unit 2112
- 6380 Raleigh St Unit 2111
- 6380 Raleigh St Unit 2116
- 6380 Raleigh St Unit 2115
- 6380 Raleigh St Unit 2114
- 6380 Raleigh St Unit 2113
- 6380 Raleigh St Unit 2102
- 6380 Raleigh St Unit 2101
- 6380 Raleigh St Unit 2104
- 6380 Raleigh St Unit 10
- 6380 Raleigh St Unit 160
- 6364 Raleigh St Unit 30
- 6364 Raleigh St Unit 1602
- 6364 Raleigh St Unit 1611
- 6364 Raleigh St Unit 1601
- 6364 Raleigh St Unit 1614
- 6364 Raleigh St Unit 1613
- 6364 Raleigh St Unit 1612