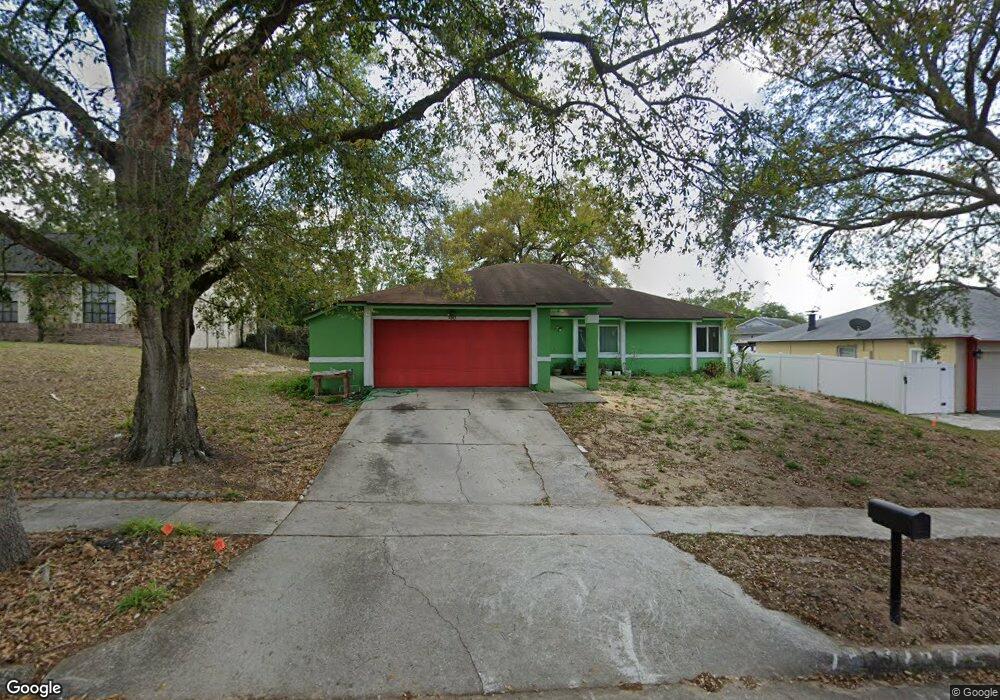
6383 Powers Pointe Cir Orlando, FL 32818
Estimated Value: $284,000 - $308,000
3
Beds
2
Baths
1,095
Sq Ft
$270/Sq Ft
Est. Value
About This Home
This home is located at 6383 Powers Pointe Cir, Orlando, FL 32818 and is currently estimated at $295,480, approximately $269 per square foot. 6383 Powers Pointe Cir is a home located in Orange County with nearby schools including Lake Gem Elementary School, Meadowbrook Middle School, and Evans High School.
Ownership History
Date
Name
Owned For
Owner Type
Purchase Details
Closed on
Oct 31, 2005
Sold by
Khan Ashley
Bought by
Ramlakhan Gobin
Current Estimated Value
Home Financials for this Owner
Home Financials are based on the most recent Mortgage that was taken out on this home.
Original Mortgage
$136,000
Outstanding Balance
$74,335
Interest Rate
6%
Mortgage Type
Fannie Mae Freddie Mac
Estimated Equity
$221,145
Purchase Details
Closed on
Jun 10, 2005
Sold by
Espinosa Samuel and Espinosa Maria E
Bought by
Khan Ashley
Home Financials for this Owner
Home Financials are based on the most recent Mortgage that was taken out on this home.
Original Mortgage
$110,400
Interest Rate
7.25%
Mortgage Type
Fannie Mae Freddie Mac
Purchase Details
Closed on
Mar 17, 1994
Sold by
Carrasquillo Jose L and Carrasquillo Lenies M
Bought by
Espinosa Samuels and Espinosa Maria E
Create a Home Valuation Report for This Property
The Home Valuation Report is an in-depth analysis detailing your home's value as well as a comparison with similar homes in the area
Home Values in the Area
Average Home Value in this Area
Purchase History
| Date | Buyer | Sale Price | Title Company |
|---|---|---|---|
| Ramlakhan Gobin | $170,000 | Vic Fidelity Title Corp | |
| Khan Ashley | $138,000 | Vic Fidelity Title Corp | |
| Espinosa Samuels | $69,100 | -- |
Source: Public Records
Mortgage History
| Date | Status | Borrower | Loan Amount |
|---|---|---|---|
| Open | Ramlakhan Gobin | $136,000 | |
| Previous Owner | Khan Ashley | $110,400 |
Source: Public Records
Tax History Compared to Growth
Tax History
| Year | Tax Paid | Tax Assessment Tax Assessment Total Assessment is a certain percentage of the fair market value that is determined by local assessors to be the total taxable value of land and additions on the property. | Land | Improvement |
|---|---|---|---|---|
| 2025 | $3,506 | $179,516 | -- | -- |
| 2024 | $3,149 | $179,516 | -- | -- |
| 2023 | $3,149 | $212,367 | $60,000 | $152,367 |
| 2022 | $2,670 | $161,815 | $45,000 | $116,815 |
| 2021 | $2,455 | $140,879 | $38,000 | $102,879 |
| 2020 | $2,257 | $138,788 | $35,000 | $103,788 |
| 2019 | $2,224 | $132,463 | $37,900 | $94,563 |
| 2018 | $2,064 | $119,504 | $45,000 | $74,504 |
| 2017 | $1,843 | $98,962 | $25,000 | $73,962 |
| 2016 | $1,608 | $76,132 | $12,000 | $64,132 |
| 2015 | $1,570 | $73,923 | $13,000 | $60,923 |
| 2014 | $1,480 | $64,214 | $15,000 | $49,214 |
Source: Public Records
Map
Nearby Homes
- 6360 Powers Pointe Cir
- 4719 Miranda Cir
- 6906 Colony Oaks Ln
- 6460 Preakness Dr
- 6239 Fox Hunt Trail
- 0 Fort Christmas Rd Unit MFRO6244659
- 0 Fort Christmas Rd Unit MFRO6244658
- 0 Fort Christmas Rd Unit MFRO6244660
- 6780 Rubens Ct
- 5400 Fox Briar Trail
- 6432 Lake Horseshoe Dr
- 6112 Fox Hunt Trail
- 6808 Galle Ct
- 7172 White Trillium Cir
- 4520 N Hiawassee Rd
- 6572 Whirlaway Cir
- 5972 Kenlyn Ct
- 7031 Gray Shadow St
- 5610 Marie Ct
- 6964 Hyland Oaks Dr
- 6377 Powers Pointe Cir
- 6389 Powers Pointe Cir
- 6435 Jennifer Jean Dr
- 6395 Powers Pointe Cir
- 6423 Jennifer Jean Dr
- 6371 Powers Pointe Cir
- 6390 Powers Pointe Cir
- 6419 Jennifer Jean Dr
- 6365 Powers Pointe Cir
- 6441 Jennifer Jean Dr
- 6396 Powers Pointe Cir
- 6403 Powers Pointe Cir
- 6404 Powers Pointe Cir
- 6430 Jennifer Jean Dr
- 6411 Jennifer Jean Dr
- 6436 Jennifer Jean Dr
- 4738 Jonathan Charles Dr
- 6424 Jennifer Jean Dr
- 6409 Powers Pointe Cir
- 6416 Powers Pointe Cir