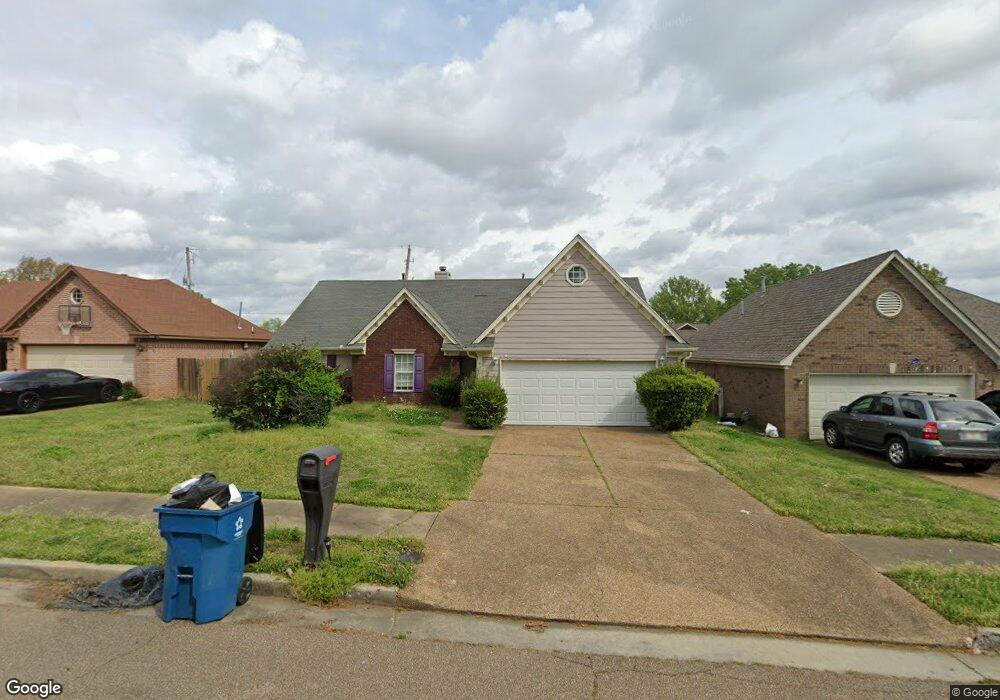
6384 Ragan Farm Dr Memphis, TN 38141
Parkway Village NeighborhoodEstimated Value: $168,000 - $210,000
3
Beds
2
Baths
1,451
Sq Ft
$131/Sq Ft
Est. Value
About This Home
This home is located at 6384 Ragan Farm Dr, Memphis, TN 38141 and is currently estimated at $190,699, approximately $131 per square foot. 6384 Ragan Farm Dr is a home located in Shelby County with nearby schools including Ross Elementary School, Kirby High School, and Memphis Business Academy Hickory Hill Middle School.
Ownership History
Date
Name
Owned For
Owner Type
Purchase Details
Closed on
Jun 10, 2022
Sold by
Cantrece Smith
Bought by
New Home Ventures Llc
Current Estimated Value
Home Financials for this Owner
Home Financials are based on the most recent Mortgage that was taken out on this home.
Original Mortgage
$123,600
Interest Rate
5.27%
Mortgage Type
Construction
Purchase Details
Closed on
Oct 15, 2001
Sold by
Fleetwood Brent
Bought by
Smith Cantrece
Home Financials for this Owner
Home Financials are based on the most recent Mortgage that was taken out on this home.
Original Mortgage
$100,875
Interest Rate
6.85%
Purchase Details
Closed on
Jun 5, 2000
Sold by
Modesto Thomas G
Bought by
Fleetwood Brent
Home Financials for this Owner
Home Financials are based on the most recent Mortgage that was taken out on this home.
Original Mortgage
$86,850
Interest Rate
8.27%
Mortgage Type
Balloon
Purchase Details
Closed on
Jun 29, 1995
Bought by
Modesto Thomas G
Create a Home Valuation Report for This Property
The Home Valuation Report is an in-depth analysis detailing your home's value as well as a comparison with similar homes in the area
Home Values in the Area
Average Home Value in this Area
Purchase History
| Date | Buyer | Sale Price | Title Company |
|---|---|---|---|
| New Home Ventures Llc | $160,000 | Griffin Clift Everton And Masc | |
| Smith Cantrece | $103,995 | -- | |
| Fleetwood Brent | $96,500 | -- | |
| Modesto Thomas G | $91,900 | -- |
Source: Public Records
Mortgage History
| Date | Status | Borrower | Loan Amount |
|---|---|---|---|
| Closed | New Home Ventures Llc | $123,600 | |
| Previous Owner | Smith Cantrece | $100,875 | |
| Previous Owner | Fleetwood Brent | $86,850 |
Source: Public Records
Tax History Compared to Growth
Tax History
| Year | Tax Paid | Tax Assessment Tax Assessment Total Assessment is a certain percentage of the fair market value that is determined by local assessors to be the total taxable value of land and additions on the property. | Land | Improvement |
|---|---|---|---|---|
| 2025 | $1,169 | $46,475 | $8,750 | $37,725 |
| 2024 | $1,169 | $34,475 | $6,850 | $27,625 |
| 2023 | $1,169 | $34,475 | $6,850 | $27,625 |
| 2022 | $1,169 | $34,475 | $6,850 | $27,625 |
| 2021 | $1,189 | $34,475 | $6,850 | $27,625 |
| 2020 | $969 | $23,925 | $5,000 | $18,925 |
| 2019 | $969 | $23,925 | $5,000 | $18,925 |
| 2018 | $969 | $23,925 | $5,000 | $18,925 |
| 2017 | $983 | $23,925 | $5,000 | $18,925 |
| 2016 | $975 | $22,300 | $0 | $0 |
| 2014 | $975 | $22,300 | $0 | $0 |
Source: Public Records
Map
Nearby Homes
- 5389 Chinkapin Oak Cove
- 5340 Shady Ridge Cove
- 9082 Fox Cove
- 9091 Hunters Ridge Dr
- 6623 Cherry Bark Dr
- 6716 Shoreline Cir
- 6744 Shoreline Cir
- 6770 Shoreline Cir
- 9142 Mineral Wells Rd
- 8140 Hunters Hill Cove
- 8939 Youngblood Rd
- 4868 Water Fowl Ln
- 4821 Blue Wing St
- 7885 Hunters Bend Cove
- 6941 Bennington Cir
- 8778 Mwc Rd
- 4406 John Wood Ln
- 4432 John Wood Ln
- 6732 Henredon Dr
- 4741 Ross Creek Dr
- 6390 Ragan Farm Dr
- 6378 Ragan Farm Dr
- 6391 Meadow Cross Cove
- 6398 Ragan Farm Dr
- 6385 Meadow Cross Cove
- 6385 Ragan Farm Dr
- 5400 Ragan Ridge Dr
- 6398 Meadow Cross Cove
- 5394 Ragan Ridge Dr
- 6404 Ragan Farm Dr
- 6373 Ragan Farm Dr
- 5417 Meadow Cross Dr
- 6405 Meadow Cross Cove
- 5388 Ragan Ridge Dr
- 6410 Ragan Farm Dr
- 6363 Ragan Farm Dr
- 6384 Meadow Cross Cove
- 6411 Meadow Cross Cove
- 5382 Ragan Ridge Dr
- 6416 Ragan Farm Dr