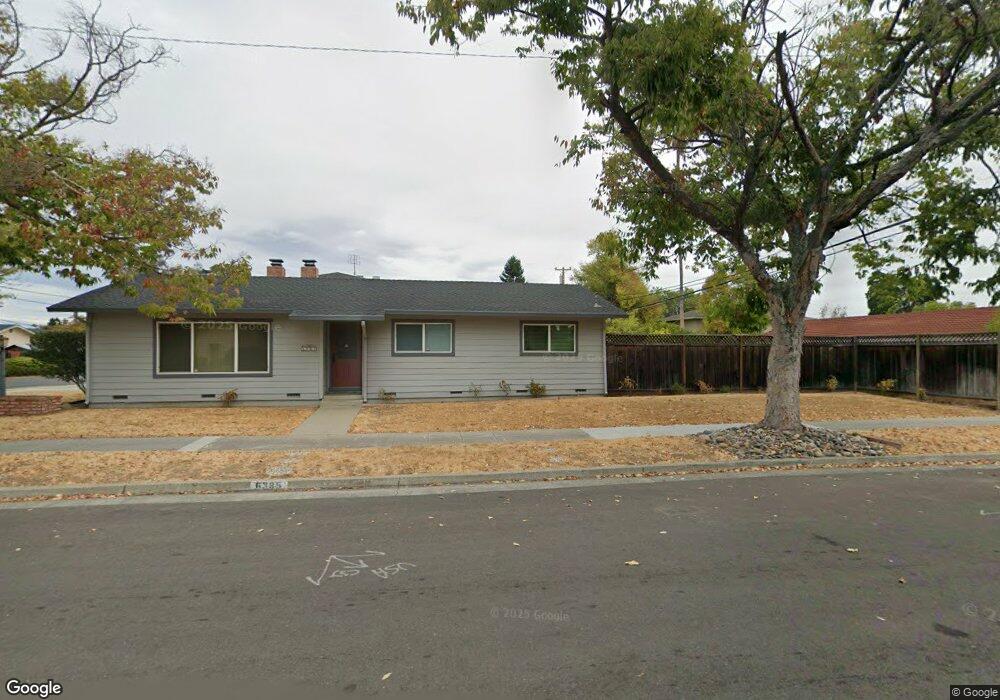
6385 Ivy Ln San Jose, CA 95129
West San Jose NeighborhoodEstimated Value: $2,963,000 - $3,076,000
3
Beds
2
Baths
1,300
Sq Ft
$2,314/Sq Ft
Est. Value
About This Home
This home is located at 6385 Ivy Ln, San Jose, CA 95129 and is currently estimated at $3,008,671, approximately $2,314 per square foot. 6385 Ivy Ln is a home located in Santa Clara County with nearby schools including Nelson S. Dilworth Elementary School, Joaquin Miller Middle, and Lynbrook High School.
Ownership History
Date
Name
Owned For
Owner Type
Purchase Details
Closed on
Oct 18, 2001
Sold by
Crowley Alexander Barbara J
Bought by
Hsu Jonsky and Chao Shou Yeh
Current Estimated Value
Home Financials for this Owner
Home Financials are based on the most recent Mortgage that was taken out on this home.
Original Mortgage
$416,000
Outstanding Balance
$155,211
Interest Rate
6.25%
Estimated Equity
$2,853,460
Purchase Details
Closed on
Apr 13, 1999
Sold by
Alexander Donn L and Ba Crowley Alexander
Bought by
Crowley Alexander Barbara J
Create a Home Valuation Report for This Property
The Home Valuation Report is an in-depth analysis detailing your home's value as well as a comparison with similar homes in the area
Home Values in the Area
Average Home Value in this Area
Purchase History
| Date | Buyer | Sale Price | Title Company |
|---|---|---|---|
| Hsu Jonsky | $520,000 | Old Republic Title Company | |
| Crowley Alexander Barbara J | $227,500 | Chicago Title Co |
Source: Public Records
Mortgage History
| Date | Status | Borrower | Loan Amount |
|---|---|---|---|
| Open | Hsu Jonsky | $416,000 |
Source: Public Records
Tax History Compared to Growth
Tax History
| Year | Tax Paid | Tax Assessment Tax Assessment Total Assessment is a certain percentage of the fair market value that is determined by local assessors to be the total taxable value of land and additions on the property. | Land | Improvement |
|---|---|---|---|---|
| 2025 | $10,320 | $768,177 | $664,778 | $103,399 |
| 2024 | $10,320 | $753,116 | $651,744 | $101,372 |
| 2023 | $10,184 | $738,350 | $638,965 | $99,385 |
| 2022 | $10,244 | $723,874 | $626,437 | $97,437 |
| 2021 | $10,077 | $709,681 | $614,154 | $95,527 |
| 2020 | $9,874 | $702,405 | $607,857 | $94,548 |
| 2019 | $9,661 | $688,634 | $595,939 | $92,695 |
| 2018 | $9,392 | $675,132 | $584,254 | $90,878 |
| 2017 | $9,342 | $661,896 | $572,799 | $89,097 |
| 2016 | $9,058 | $648,918 | $561,568 | $87,350 |
| 2015 | $8,997 | $639,171 | $553,133 | $86,038 |
| 2014 | $8,418 | $626,651 | $542,298 | $84,353 |
Source: Public Records
Map
Nearby Homes
- 1681 Danromas Way
- 6757 Devonshire Dr
- 12035 Brookglen Dr
- 12637 Lido Way
- 7130 Rainbow Dr Unit 2
- 6893 Chantel Ct
- 6886 Chantel Ct
- 7150 Rainbow Dr Unit 42
- 19817 Veronica Dr
- 18991 Greenbrook Ct
- 6944 Chantel Ct
- 1083 Miller Ave
- 5635 W Walbrook Dr
- 12790 Glen Arbor Ct
- 1063 Whitebick Dr
- 6117 Brigantine Dr
- 7344 Rainbow Dr
- 18396 Mill Ct
- 11510 Bianchini Ln
- 1040 W Riverside Way