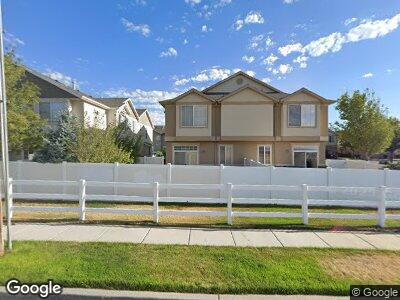
6385 W Passenger Ct West Jordan, UT 84081
Oquirrh NeighborhoodEstimated Value: $361,000 - $399,000
3
Beds
3
Baths
1,411
Sq Ft
$272/Sq Ft
Est. Value
About This Home
This home is located at 6385 W Passenger Ct, West Jordan, UT 84081 and is currently estimated at $384,401, approximately $272 per square foot. 6385 W Passenger Ct is a home located in Salt Lake County with nearby schools including Falcon Ridge School, Sunset Ridge Middle School, and Copper Hills High School.
Ownership History
Date
Name
Owned For
Owner Type
Purchase Details
Closed on
May 28, 2010
Sold by
Boyer Stephen Richlee and Boyer Jennifer Lynn
Bought by
Vise Angie K
Current Estimated Value
Home Financials for this Owner
Home Financials are based on the most recent Mortgage that was taken out on this home.
Original Mortgage
$155,900
Outstanding Balance
$105,347
Interest Rate
4.75%
Mortgage Type
FHA
Estimated Equity
$279,054
Purchase Details
Closed on
Jun 11, 2008
Sold by
Truscott Christine J
Bought by
Boyer Stephen Richlee and Boyer Jennifer Lynn
Home Financials for this Owner
Home Financials are based on the most recent Mortgage that was taken out on this home.
Original Mortgage
$177,219
Interest Rate
6.05%
Mortgage Type
FHA
Purchase Details
Closed on
Apr 12, 2006
Sold by
Oquirrh Highlands Condominiums Llc
Bought by
Truscott Christine J
Home Financials for this Owner
Home Financials are based on the most recent Mortgage that was taken out on this home.
Original Mortgage
$162,501
Interest Rate
6.35%
Mortgage Type
FHA
Create a Home Valuation Report for This Property
The Home Valuation Report is an in-depth analysis detailing your home's value as well as a comparison with similar homes in the area
Home Values in the Area
Average Home Value in this Area
Purchase History
| Date | Buyer | Sale Price | Title Company |
|---|---|---|---|
| Vise Angie K | -- | Integrated Title Ins Svcs | |
| Boyer Stephen Richlee | -- | Equity Title | |
| Truscott Christine J | -- | Us Title Of Utah |
Source: Public Records
Mortgage History
| Date | Status | Borrower | Loan Amount |
|---|---|---|---|
| Open | Vise Angie K | $155,900 | |
| Previous Owner | Boyer Stephen Richlee | $177,219 | |
| Previous Owner | Truscott Christine J | $162,501 |
Source: Public Records
Tax History Compared to Growth
Tax History
| Year | Tax Paid | Tax Assessment Tax Assessment Total Assessment is a certain percentage of the fair market value that is determined by local assessors to be the total taxable value of land and additions on the property. | Land | Improvement |
|---|---|---|---|---|
| 2023 | $2,706 | $364,400 | $109,300 | $255,100 |
| 2022 | $2,763 | $375,100 | $112,500 | $262,600 |
| 2021 | $2,085 | $266,300 | $79,900 | $186,400 |
| 2020 | $2,092 | $246,800 | $74,000 | $172,800 |
| 2019 | $1,936 | $227,700 | $68,300 | $159,400 |
| 2018 | $1,736 | $201,300 | $60,400 | $140,900 |
| 2017 | $1,594 | $182,300 | $54,700 | $127,600 |
| 2016 | $1,483 | $162,600 | $48,800 | $113,800 |
| 2015 | $1,468 | $154,700 | $46,400 | $108,300 |
| 2014 | $1,484 | $153,200 | $45,900 | $107,300 |
Source: Public Records
Map
Nearby Homes
- 6366 W Passenger Ln
- 6953 Traveler Ln Unit 213-B
- 6351 W Traveler Ln
- 6939 Tourist Ln Unit 2C
- 6324 Traveler Ln
- 6318 W Traveler Ln
- 6990 S High Bluff Dr
- 6258 W Graceland Way
- 6116 W Graceland Way
- 6761 S High Bluff Dr
- 6857 S 6115 W
- 6097 Nellies St
- 6097 W Nellies St
- 6869 S Static Peak Dr Unit 282
- 6872 S Static Peak Dr Unit 256
- 6864 S Static Peak Dr Unit 258
- 6862 S Static Peak Dr Unit 259
- 6850 S Static Peak Dr Unit 261
- 6842 S Static Peak Dr Unit 263
- 6871 S Mount Meek Dr Unit 236
- 6385 W Passenger Ct
- 6385 W Passenger Ct Unit 207-2C
- 6385 Passenger Ln
- 6381 Passenger Ln
- 6381 W Passenger Ct Unit 207-3
- 6381 W Passenger Ct
- 6383 W Passenger Ct Unit 207-A
- 6383 W Passenger Ct Unit 207-1C
- 6389 W Passenger Ct Unit 208-3A
- 6383 Passenger Ln
- 6389 Passenger Ln
- 6393 W Passenger Ct Unit 208-2A
- 6393 Passenger Ln
- 6391 W Passenger Ct
- 6391 W Passenger Ct Unit 208-1A
- 6391 Passenger Ln
- 6365 W Passenger Ln
- 6365 W Passenger Ln Unit 204-2B
- 6363 Passenger Ln
- 6363 W Passenger Ln Unit 204-1B