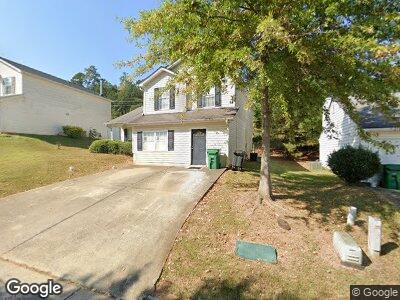
6387 Alford Cir Lithonia, GA 30058
Estimated Value: $242,000 - $260,000
3
Beds
3
Baths
1,796
Sq Ft
$140/Sq Ft
Est. Value
About This Home
This home is located at 6387 Alford Cir, Lithonia, GA 30058 and is currently estimated at $250,542, approximately $139 per square foot. 6387 Alford Cir is a home located in DeKalb County with nearby schools including Pine Ridge Elementary School, Stephenson Middle School, and Stephenson High School.
Ownership History
Date
Name
Owned For
Owner Type
Purchase Details
Closed on
Feb 29, 2008
Sold by
Anderson James C and Anderson Rhonda L
Bought by
Williams Shawnya C
Current Estimated Value
Home Financials for this Owner
Home Financials are based on the most recent Mortgage that was taken out on this home.
Original Mortgage
$92,270
Interest Rate
5.46%
Mortgage Type
FHA
Purchase Details
Closed on
Aug 5, 2002
Sold by
Anderson James C
Bought by
Anderson James C and Anderson Rhonda L
Home Financials for this Owner
Home Financials are based on the most recent Mortgage that was taken out on this home.
Original Mortgage
$102,000
Interest Rate
5.38%
Mortgage Type
New Conventional
Purchase Details
Closed on
Mar 29, 1999
Sold by
Eastland Homes Inc
Bought by
Ball James C
Home Financials for this Owner
Home Financials are based on the most recent Mortgage that was taken out on this home.
Original Mortgage
$100,800
Interest Rate
6.85%
Mortgage Type
FHA
Create a Home Valuation Report for This Property
The Home Valuation Report is an in-depth analysis detailing your home's value as well as a comparison with similar homes in the area
Home Values in the Area
Average Home Value in this Area
Purchase History
| Date | Buyer | Sale Price | Title Company |
|---|---|---|---|
| Williams Shawnya C | $93,000 | -- | |
| Anderson James C | -- | -- | |
| Ball James C | $100,900 | -- |
Source: Public Records
Mortgage History
| Date | Status | Borrower | Loan Amount |
|---|---|---|---|
| Open | Williams Shawnya C | $110,500 | |
| Closed | Williams Shawnya C | $92,270 | |
| Previous Owner | Anderson James C | $102,000 | |
| Previous Owner | Anderson James C | $17,500 | |
| Previous Owner | Ball James C | $100,800 |
Source: Public Records
Tax History Compared to Growth
Tax History
| Year | Tax Paid | Tax Assessment Tax Assessment Total Assessment is a certain percentage of the fair market value that is determined by local assessors to be the total taxable value of land and additions on the property. | Land | Improvement |
|---|---|---|---|---|
| 2023 | $2,569 | $83,240 | $10,000 | $73,240 |
| 2022 | $2,334 | $78,640 | $10,000 | $68,640 |
| 2021 | $1,965 | $62,640 | $10,000 | $52,640 |
| 2020 | $1,686 | $50,360 | $5,280 | $45,080 |
| 2019 | $1,615 | $48,640 | $5,280 | $43,360 |
| 2018 | $1,359 | $42,840 | $5,280 | $37,560 |
| 2017 | $1,379 | $40,480 | $5,280 | $35,200 |
| 2016 | $1,259 | $37,920 | $5,280 | $32,640 |
| 2014 | $1,085 | $32,880 | $5,280 | $27,600 |
Source: Public Records
Map
Nearby Homes
- 1043 Carriage Trace Cir
- 1004 Alford Ct
- 6493 Crooked Creek Place
- 1077 Crooked Creek Rd
- 6490 Battery Point
- 944 Pine Ridge Dr
- 1001 Pine Ridge Dr
- 1091 Cherry Laurel Dr
- 6579 Alford Way
- 1174 Falkirk Ln
- 1276 Huntington Place Cir
- 6452 Berryside Dr
- 6336 Lake Valley Point
- 861 Southland Pass
- 1148 Falkirk Ln
- 6341 Lake Valley Point
- 1130 Falkirk Ln
- 1229 Huntington Place Cir
- 6387 Alford Cir
- 6391 Alford Cir Unit 4
- 6381 Alford Cir
- 6395 Alford Cir Unit 4
- 6375 Alford Cir
- 0 Alford Cir 0
- 6384 Alford Cir
- 6390 Alford Cir
- 6390 Alford Cir Unit 4
- 6376 Alford Cir
- 6401 Alford Cir
- 6394 Alford Cir
- 6371 Alford Cir
- 6368 Alford Cir Unit IV
- 6400 Alford Cir
- 6405 Alford Cir
- 6367 Alford Cir Unit 4
- 1031 Alford Crossing
- 1031 Alford Crossing Unit 58
- 6364 Alford Cir Unit 4