Estimated Value: $737,557 - $801,000
3
Beds
3
Baths
1,486
Sq Ft
$517/Sq Ft
Est. Value
About This Home
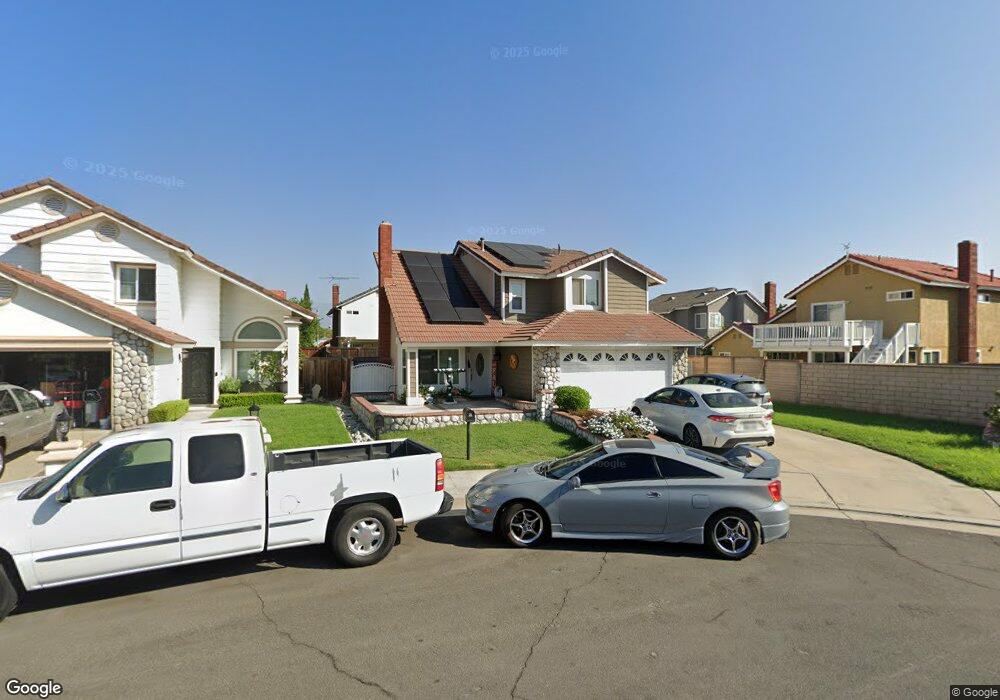
This home is located at 6388 Ashley Ct, Chino, CA 91710 and is currently estimated at $767,889, approximately $516 per square foot. 6388 Ashley Ct is a home located in San Bernardino County with nearby schools including Howard Cattle Elementary, Magnolia Junior High, and Chino High School.
Ownership History
Date
Name
Owned For
Owner Type
Purchase Details
Closed on
Oct 19, 2011
Sold by
Narula Kamlesh
Bought by
Narula Kamlesh Chander and The Subhas Chandler Narula & K
Current Estimated Value
Home Financials for this Owner
Home Financials are based on the most recent Mortgage that was taken out on this home.
Original Mortgage
$101,000
Outstanding Balance
$9,495
Interest Rate
4.01%
Mortgage Type
New Conventional
Estimated Equity
$758,394
Purchase Details
Closed on
Sep 21, 2006
Sold by
Narula Subhash C and Narula Kamlesh
Bought by
Narula Subhash Chander and Narula Kamlesh
Purchase Details
Closed on
Jan 22, 2001
Sold by
Krogman Kirk W and Krogman Ellen M
Bought by
Narula Subash C and Narula Kamlesh
Home Financials for this Owner
Home Financials are based on the most recent Mortgage that was taken out on this home.
Original Mortgage
$162,350
Interest Rate
6.97%
Create a Home Valuation Report for This Property
The Home Valuation Report is an in-depth analysis detailing your home's value as well as a comparison with similar homes in the area
Home Values in the Area
Average Home Value in this Area
Purchase History
| Date | Buyer | Sale Price | Title Company |
|---|---|---|---|
| Narula Kamlesh Chander | -- | None Available | |
| Narula Kamlesh | -- | None Available | |
| Narula Subhash Chander | -- | None Available | |
| Narula Subash C | $203,000 | Chicago Title Insurance |
Source: Public Records
Mortgage History
| Date | Status | Borrower | Loan Amount |
|---|---|---|---|
| Open | Narula Kamlesh | $101,000 | |
| Previous Owner | Narula Subash C | $162,350 |
Source: Public Records
Tax History
| Year | Tax Paid | Tax Assessment Tax Assessment Total Assessment is a certain percentage of the fair market value that is determined by local assessors to be the total taxable value of land and additions on the property. | Land | Improvement |
|---|---|---|---|---|
| 2025 | $3,404 | $305,892 | $107,062 | $198,830 |
| 2024 | $3,314 | $299,894 | $104,963 | $194,931 |
| 2023 | $3,223 | $294,014 | $102,905 | $191,109 |
| 2022 | $3,203 | $288,249 | $100,887 | $187,362 |
| 2021 | $3,140 | $282,597 | $98,909 | $183,688 |
| 2020 | $3,099 | $279,700 | $97,895 | $181,805 |
| 2019 | $3,042 | $274,215 | $95,975 | $178,240 |
| 2018 | $2,972 | $268,838 | $94,093 | $174,745 |
| 2017 | $2,916 | $263,567 | $92,248 | $171,319 |
| 2016 | $2,725 | $258,399 | $90,439 | $167,960 |
| 2015 | $2,668 | $254,518 | $89,081 | $165,437 |
| 2014 | $2,615 | $249,532 | $87,336 | $162,196 |
Source: Public Records
Map
Nearby Homes
- 4690 Avondale Ct
- 4602 Granville Ct
- 11610 Granville Place
- 6157 Breckinridge Ct
- 6594 Manzanita Ct
- 6614 Manzanita Ct
- 14000 San Antonio Ave
- 13284 Cypress Ave
- 13551 Barkley Place
- 13290 San Antonio Ave
- 5940 Breckinridge Ln
- 6732 Sugar Pine St
- 5881 Ashley Ct
- 6952 Silverado St
- 5945 Olvera Ct
- 14170 Durazno Ave
- 6212 Athena St
- 13266 Murano Ave Unit 19
- 13462 Mashona Ave
- 13846 Farmhouse Ave
- 6380 Ashley Ct
- 13646 Bunker Hill Place
- 13638 Bunker Hill Place
- 13654 Bunker Hill Place
- 6389 Carter St
- 6372 Ashley Ct
- 6381 Carter St
- 13628 Bunker Hill Place
- 13662 Bunker Hill Place
- 6373 Carter St
- 6364 Ashley Ct
- 13670 Bunker Hill Place
- 6387 Ashley Ct
- 6371 Ashley Ct
- 6379 Ashley Ct
- 6365 Carter St
- 6363 Ashley Ct
- 13678 Bunker Hill Place
- 13645 Bunker Hill Place
- 13637 Bunker Hill Place
Your Personal Tour Guide
Ask me questions while you tour the home.