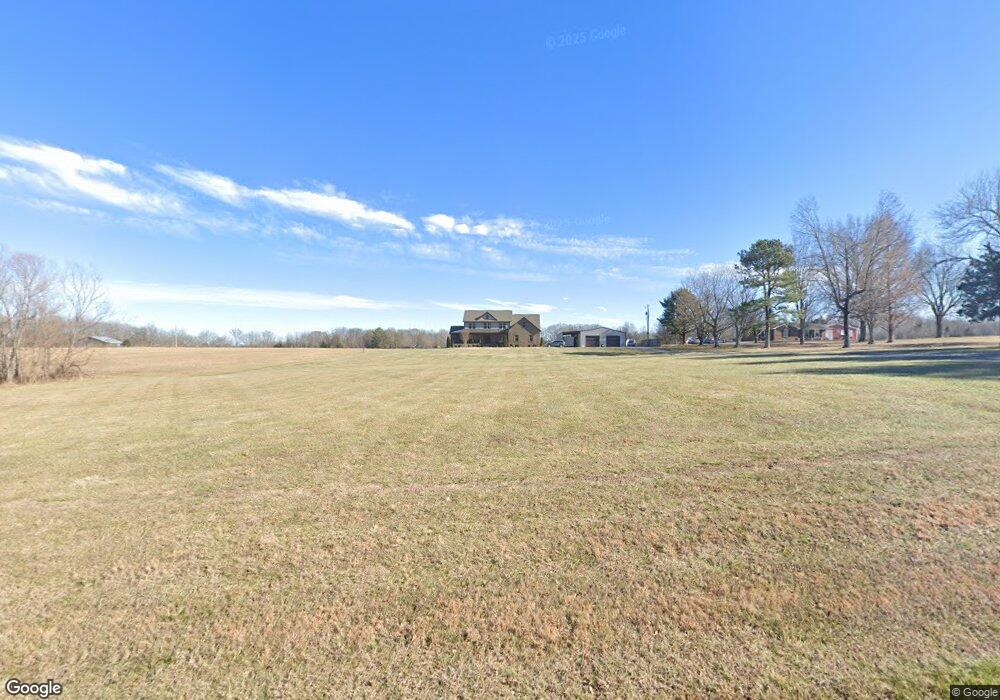
6389 Williams Rd Cross Plains, TN 37049
Estimated Value: $855,000 - $996,541
--
Bed
1
Bath
3,221
Sq Ft
$287/Sq Ft
Est. Value
About This Home
This home is located at 6389 Williams Rd, Cross Plains, TN 37049 and is currently estimated at $925,771, approximately $287 per square foot. 6389 Williams Rd is a home with nearby schools including East Robertson Elementary School and East Robertson High School.
Ownership History
Date
Name
Owned For
Owner Type
Purchase Details
Closed on
May 17, 2017
Sold by
Sneed Ricky and Sneed Ricky D
Bought by
Sneed Ricky D and Sneed Amy N
Current Estimated Value
Purchase Details
Closed on
Aug 4, 2014
Sold by
Smith Robert D
Bought by
Sneed Ricky
Purchase Details
Closed on
Aug 13, 2004
Sold by
Brown Connie R and Brown Terry W
Bought by
Janiece Sterzer and Janiece Russell D
Purchase Details
Closed on
Jul 30, 2004
Bought by
Smith Robert
Purchase Details
Closed on
Jul 29, 2004
Sold by
Brown Connie R
Bought by
Radic Tanya S
Purchase Details
Closed on
Mar 3, 2004
Sold by
Darrell Mceachron
Bought by
Stephen Taylor
Purchase Details
Closed on
Jan 30, 2004
Sold by
Eden Dorothy L
Bought by
Darrell Mceachron
Purchase Details
Closed on
Jan 29, 2004
Sold by
Springfield Tn City Of
Bought by
Darrell Mceachron
Purchase Details
Closed on
Aug 31, 2000
Sold by
Brown Terry W
Bought by
Sterzer Russell D
Purchase Details
Closed on
Dec 9, 1981
Bought by
Eden William H
Create a Home Valuation Report for This Property
The Home Valuation Report is an in-depth analysis detailing your home's value as well as a comparison with similar homes in the area
Home Values in the Area
Average Home Value in this Area
Purchase History
| Date | Buyer | Sale Price | Title Company |
|---|---|---|---|
| Sneed Ricky D | -- | Warranty Title Ins Co Inc | |
| Sneed Ricky | $58,000 | -- | |
| Janiece Sterzer | $13,500 | -- | |
| Smith Robert | $40,000 | -- | |
| Radic Tanya S | $245,900 | -- | |
| Stephen Taylor | -- | -- | |
| Darrell Mceachron | -- | -- | |
| Darrell Mceachron | $7,300 | -- | |
| Sterzer Russell D | $182,000 | -- | |
| Eden William H | -- | -- |
Source: Public Records
Tax History Compared to Growth
Tax History
| Year | Tax Paid | Tax Assessment Tax Assessment Total Assessment is a certain percentage of the fair market value that is determined by local assessors to be the total taxable value of land and additions on the property. | Land | Improvement |
|---|---|---|---|---|
| 2024 | $3,822 | $212,325 | $64,025 | $148,300 |
| 2023 | $3,822 | $212,325 | $64,025 | $148,300 |
| 2022 | $3,152 | $122,350 | $16,000 | $106,350 |
| 2021 | $3,152 | $122,350 | $16,000 | $106,350 |
| 2020 | $3,152 | $122,350 | $16,000 | $106,350 |
| 2019 | $3,152 | $122,350 | $16,000 | $106,350 |
| 2018 | $3,152 | $122,350 | $16,000 | $106,350 |
| 2017 | $2,528 | $81,950 | $15,075 | $66,875 |
| 2016 | $465 | $15,075 | $15,075 | $0 |
| 2015 | $446 | $15,075 | $15,075 | $0 |
| 2014 | $446 | $15,075 | $15,075 | $0 |
Source: Public Records
Map
Nearby Homes
- 6400 Williams Rd
- 6400 Williams Rd
- 8935 Cedar Grove Rd
- 4675 Wills Rd
- 4984 Somerville Rd
- 2671 Friendship Rd
- 8288 Guthrie Rd
- 0 Jimson Rd
- 4706 Rock House Rd
- 2019 Friendship Rd
- 8265 Guthrie Rd
- 4888 Rock House Rd
- 1783 Friendship Rd
- 4557 Yates Rd
- 8205 Brownstone Extension
- 1653 Friendship Rd
- 8127 Pleasant Hill Rd
- 8044 Pleasant Hill Rd
- 4648 Highway 31 W
- 4628 Hwy 31w
- 6379 Williams Rd
- 6379 Williams Rd
- 6376 Williams Rd
- 6509 Williams Rd
- 6344 Williams Rd
- 4954 Williams Rd
- 6283 Williams Rd
- 6477 Williams Rd
- 6477 Williams Rd
- 6553 Williams Rd
- 4943 Williams Rd
- 6246 Williams Rd
- 6246 Williams Rd
- 6570 Williams Rd
- 4868 Williams Rd
- 6167 Williams Rd
- 6657 Williams Rd
- 6582 Williams Rd
- 6657 Williams Rd
- 6657 Williams Rd