638C 11th Ave Honolulu, HI 96816
Kaimuki NeighborhoodEstimated Value: $916,472 - $1,140,000
3
Beds
2
Baths
1,120
Sq Ft
$904/Sq Ft
Est. Value
About This Home
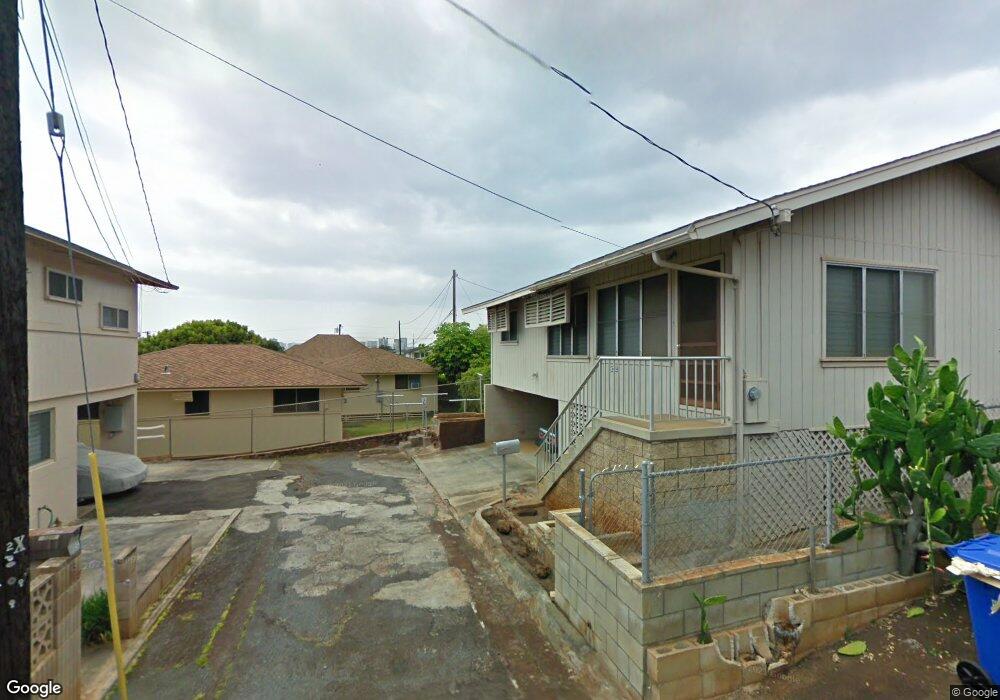
This home is located at 638C 11th Ave, Honolulu, HI 96816 and is currently estimated at $1,012,868, approximately $904 per square foot. 638C 11th Ave is a home located in Honolulu County with nearby schools including King Liholiho Elementary School, Kaimuki Middle School, and Kalani High School.
Ownership History
Date
Name
Owned For
Owner Type
Purchase Details
Closed on
Apr 1, 2020
Sold by
Tsang Kenny Kakit and Tsang Mari Miyamoto
Bought by
Tsang Kenny Kakit and Tsang Mari Miyamoto
Current Estimated Value
Purchase Details
Closed on
Jan 7, 2013
Sold by
Takaoka Steven S
Bought by
Tsang Kenny Kakit and Tsang Mari Miyamoto
Home Financials for this Owner
Home Financials are based on the most recent Mortgage that was taken out on this home.
Original Mortgage
$433,600
Outstanding Balance
$300,070
Interest Rate
3.27%
Estimated Equity
$712,798
Purchase Details
Closed on
Sep 16, 2010
Sold by
Takaoka Steven S and Miwa Carolyn N
Bought by
Takaoka Frances Y
Purchase Details
Closed on
Feb 2, 2007
Sold by
Takaoka Steven S and Miwa Carolyn N
Bought by
Miwa Melvin N and Miwa Carolyn N
Purchase Details
Closed on
May 10, 2005
Sold by
Takaoka Yoshie F
Bought by
Takaoka Steven S and Miwa Carolyn N
Create a Home Valuation Report for This Property
The Home Valuation Report is an in-depth analysis detailing your home's value as well as a comparison with similar homes in the area
Home Values in the Area
Average Home Value in this Area
Purchase History
| Date | Buyer | Sale Price | Title Company |
|---|---|---|---|
| Tsang Kenny Kakit | -- | None Available | |
| Tsang Kenny Kakit | -- | None Available | |
| Tsang Kenny Kakit | $542,000 | Tg | |
| Tsang Kenny Kakit | $542,000 | Tg | |
| Takaoka Frances Y | -- | None Available | |
| Miwa Melvin N | -- | None Available | |
| Takaoka Steven S | -- | None Available | |
| Takaoka Steven S | -- | -- |
Source: Public Records
Mortgage History
| Date | Status | Borrower | Loan Amount |
|---|---|---|---|
| Open | Tsang Kenny Kakit | $433,600 | |
| Closed | Tsang Kenny Kakit | $433,600 |
Source: Public Records
Tax History Compared to Growth
Tax History
| Year | Tax Paid | Tax Assessment Tax Assessment Total Assessment is a certain percentage of the fair market value that is determined by local assessors to be the total taxable value of land and additions on the property. | Land | Improvement |
|---|---|---|---|---|
| 2025 | $2,181 | $779,200 | $615,600 | $163,600 |
| 2024 | $2,181 | $743,000 | $586,300 | $156,700 |
| 2023 | $2,118 | $805,100 | $586,300 | $218,800 |
| 2022 | $2,672 | $863,300 | $527,700 | $335,600 |
| 2021 | $2,389 | $782,700 | $486,600 | $296,100 |
| 2020 | $2,216 | $733,100 | $486,600 | $246,500 |
| 2019 | $2,205 | $710,000 | $469,000 | $241,000 |
| 2018 | $1,823 | $600,800 | $451,500 | $149,300 |
| 2017 | $1,753 | $580,800 | $439,700 | $141,100 |
| 2016 | $1,729 | $574,000 | $439,700 | $134,300 |
| 2015 | $1,925 | $550,000 | $422,100 | $127,900 |
| 2014 | $1,457 | $509,600 | $381,100 | $128,500 |
Source: Public Records
Map
Nearby Homes
- 623 10th Ave
- 718 10th Ave
- 833 10th Ave
- 766 Ocean View Dr
- 741 7th Ave
- 912 Ocean View Dr
- 3233 Francis St
- 1039 11th Ave
- 3214 Esther St
- 3232 Castle St
- 911 6th Ave
- 1103 10th Ave
- 3266 Kaimuki Ave
- 1139 9th Ave Unit 1201
- 1139 9th Ave Unit 303
- 1139 9th Ave Unit 703
- 1139 9th Ave Unit 304
- 3115 Kaunaoa St
- 3427 Waialae Ave
- 3117 Hunter St