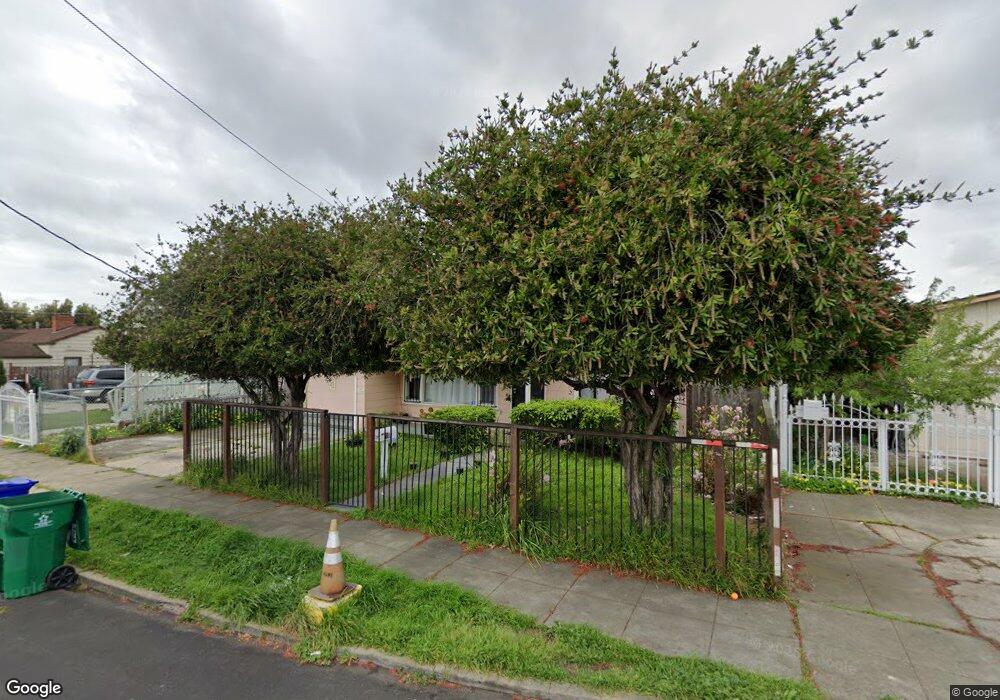
639 12th St Richmond, CA 94801
Iron Triangle NeighborhoodEstimated Value: $389,000 - $404,000
2
Beds
1
Bath
813
Sq Ft
$488/Sq Ft
Est. Value
About This Home
This home is located at 639 12th St, Richmond, CA 94801 and is currently estimated at $396,390, approximately $487 per square foot. 639 12th St is a home located in Contra Costa County with nearby schools including Peres Elementary School, Walter T. Helms Middle School, and Richmond High School.
Ownership History
Date
Name
Owned For
Owner Type
Purchase Details
Closed on
Mar 14, 2013
Sold by
Johnson Joyce M
Bought by
Jiang Ling
Current Estimated Value
Purchase Details
Closed on
Nov 4, 1993
Sold by
Dix Marcia
Bought by
Johnson George and Johnson Joyce M
Home Financials for this Owner
Home Financials are based on the most recent Mortgage that was taken out on this home.
Original Mortgage
$88,477
Interest Rate
6.91%
Mortgage Type
FHA
Create a Home Valuation Report for This Property
The Home Valuation Report is an in-depth analysis detailing your home's value as well as a comparison with similar homes in the area
Home Values in the Area
Average Home Value in this Area
Purchase History
| Date | Buyer | Sale Price | Title Company |
|---|---|---|---|
| Jiang Ling | $77,000 | Fidelity National Title Co | |
| Jiang Ling | -- | Fidelity National Title Co | |
| Johnson George | $88,000 | Chicago Title Company |
Source: Public Records
Mortgage History
| Date | Status | Borrower | Loan Amount |
|---|---|---|---|
| Previous Owner | Johnson George | $88,477 |
Source: Public Records
Tax History Compared to Growth
Tax History
| Year | Tax Paid | Tax Assessment Tax Assessment Total Assessment is a certain percentage of the fair market value that is determined by local assessors to be the total taxable value of land and additions on the property. | Land | Improvement |
|---|---|---|---|---|
| 2025 | $2,793 | $94,809 | $74,128 | $20,681 |
| 2024 | $2,768 | $92,951 | $72,675 | $20,276 |
| 2023 | $2,768 | $91,129 | $71,250 | $19,879 |
| 2022 | $2,681 | $89,343 | $69,853 | $19,490 |
| 2021 | $2,611 | $87,592 | $68,484 | $19,108 |
| 2019 | $2,438 | $84,996 | $66,453 | $18,543 |
| 2018 | $2,343 | $83,330 | $65,150 | $18,180 |
| 2017 | $2,269 | $81,697 | $63,873 | $17,824 |
| 2016 | $2,203 | $80,096 | $62,621 | $17,475 |
| 2015 | $2,161 | $78,894 | $61,681 | $17,213 |
| 2014 | $2,288 | $77,349 | $60,473 | $16,876 |
Source: Public Records
Map
Nearby Homes