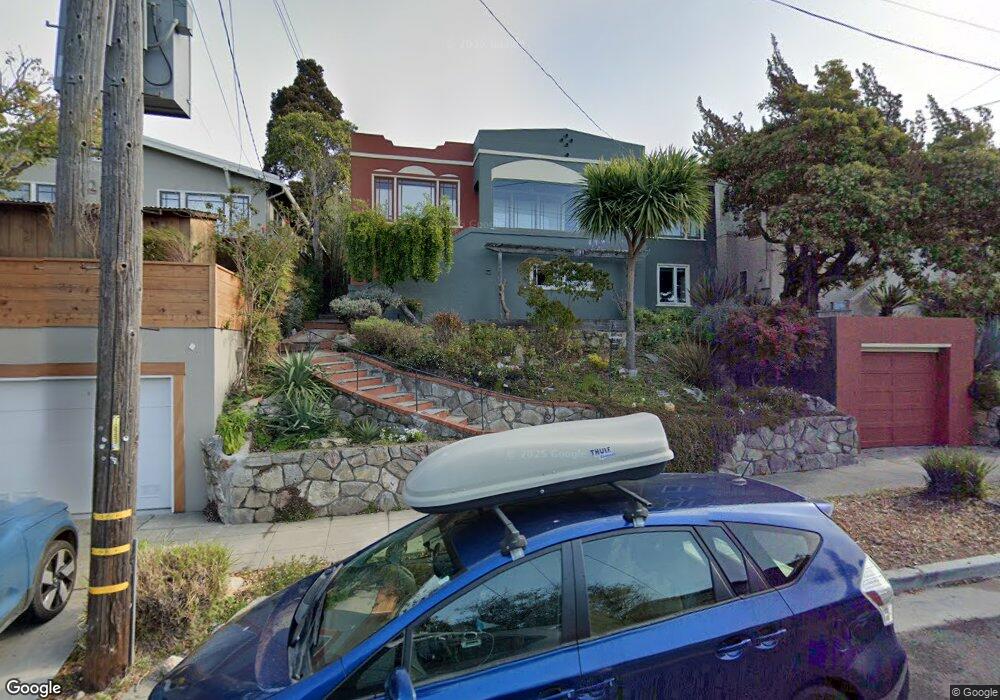
639 Colusa Ave Berkeley, CA 94707
Thousand Oaks NeighborhoodEstimated Value: $1,537,413 - $1,805,000
2
Beds
1
Bath
1,514
Sq Ft
$1,122/Sq Ft
Est. Value
About This Home
This home is located at 639 Colusa Ave, Berkeley, CA 94707 and is currently estimated at $1,698,103, approximately $1,121 per square foot. 639 Colusa Ave is a home located in Alameda County with nearby schools including Thousand Oaks Elementary School, Ruth Acty Elementary, and Berkeley Arts Magnet at Whittier School.
Ownership History
Date
Name
Owned For
Owner Type
Purchase Details
Closed on
Feb 28, 2019
Sold by
Horn Laura J
Bought by
Horn Laura J and Laura Jane Horn Trust
Current Estimated Value
Purchase Details
Closed on
Jan 21, 2011
Sold by
Horn Laura J and Miller Margaret A
Bought by
Horn Laura J and Miller Margaret A
Home Financials for this Owner
Home Financials are based on the most recent Mortgage that was taken out on this home.
Original Mortgage
$136,200
Interest Rate
4.82%
Mortgage Type
New Conventional
Purchase Details
Closed on
Jul 6, 2000
Sold by
Baylor David and Helmer Theresa
Bought by
Horn Laura J and Miller Margaret A
Home Financials for this Owner
Home Financials are based on the most recent Mortgage that was taken out on this home.
Original Mortgage
$430,000
Outstanding Balance
$151,796
Interest Rate
8.04%
Estimated Equity
$1,546,307
Create a Home Valuation Report for This Property
The Home Valuation Report is an in-depth analysis detailing your home's value as well as a comparison with similar homes in the area
Home Values in the Area
Average Home Value in this Area
Purchase History
| Date | Buyer | Sale Price | Title Company |
|---|---|---|---|
| Horn Laura J | -- | None Available | |
| Horn Laura J | -- | Chicago Title Company | |
| Horn Laura J | $610,000 | Placer Title Company |
Source: Public Records
Mortgage History
| Date | Status | Borrower | Loan Amount |
|---|---|---|---|
| Closed | Horn Laura J | $136,200 | |
| Open | Horn Laura J | $430,000 |
Source: Public Records
Tax History
| Year | Tax Paid | Tax Assessment Tax Assessment Total Assessment is a certain percentage of the fair market value that is determined by local assessors to be the total taxable value of land and additions on the property. | Land | Improvement |
|---|---|---|---|---|
| 2025 | $14,486 | $912,104 | $275,731 | $643,373 |
| 2024 | $14,486 | $894,085 | $270,325 | $630,760 |
| 2023 | $14,181 | $883,420 | $265,026 | $618,394 |
| 2022 | $13,914 | $859,101 | $259,830 | $606,271 |
| 2021 | $13,940 | $842,120 | $254,736 | $594,384 |
| 2020 | $13,152 | $840,414 | $252,124 | $588,290 |
| 2019 | $12,593 | $823,938 | $247,181 | $576,757 |
| 2018 | $12,375 | $807,785 | $242,335 | $565,450 |
| 2017 | $11,944 | $791,950 | $237,585 | $554,365 |
| 2016 | $11,537 | $776,425 | $232,927 | $543,498 |
| 2015 | $11,380 | $764,768 | $229,430 | $535,338 |
| 2014 | $11,290 | $749,793 | $224,938 | $524,855 |
Source: Public Records
Map
Nearby Homes
- 1563 Thousand Oaks Blvd
- 1983 Yosemite Rd
- 720 Key Route Blvd
- 1266 Washington Ave
- 820 Key Route Blvd
- 549 Santa Barbara Rd
- 606 Masonic Ave
- 483 Boynton Ave
- 417 Evelyn Ave Unit 205
- 938 Masonic Ave
- 770 Santa Barbara Rd
- 385 Vermont Ave
- 7316 Rockway Ave
- 1150 Washington Ave
- 225 Arlington Ave
- 1038 Pomona Ave
- 826 Indian Rock Ave
- 728 Stannage Ave
- 305 Coronado St
- 479 Kentucky Ave
- 635 Colusa Ave
- 645 Colusa Ave
- 627 Colusa Ave
- 628 Vincente Ave
- 649 Colusa Ave
- 632 Vincente Ave
- 624 Vincente Ave
- 636 Vincente Ave
- 625 Colusa Ave
- 620 Vincente Ave
- 636 Colusa Ave
- 640 Colusa Ave
- 630 Colusa Ave
- 640 Vincente Ave
- 646 Colusa Ave
- 657 Colusa Ave
- 624 Colusa Ave
- 650 Colusa Ave
- 616 Vincente Ave
- 619 Colusa Ave
Your Personal Tour Guide
Ask me questions while you tour the home.