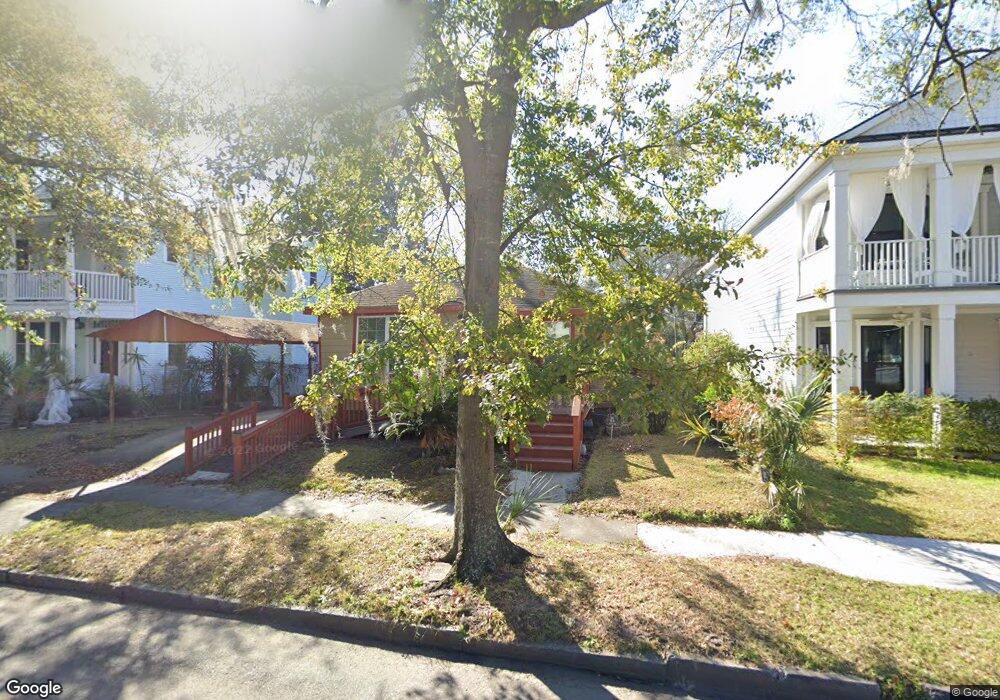
639 E 35th St Savannah, GA 31401
Midtown Savannah NeighborhoodEstimated Value: $372,356 - $459,000
3
Beds
1
Bath
1,282
Sq Ft
$325/Sq Ft
Est. Value
About This Home
This home is located at 639 E 35th St, Savannah, GA 31401 and is currently estimated at $416,839, approximately $325 per square foot. 639 E 35th St is a home located in Chatham County with nearby schools including Shuman Elementary School, Hubert Middle School, and Savannah Arts Academy.
Ownership History
Date
Name
Owned For
Owner Type
Purchase Details
Closed on
Nov 14, 2025
Sold by
Vandelay Holdings Llc
Bought by
Cottingham Alexandria Leigh and Dacosta Michael Filipe
Current Estimated Value
Home Financials for this Owner
Home Financials are based on the most recent Mortgage that was taken out on this home.
Original Mortgage
$413,250
Outstanding Balance
$412,054
Interest Rate
6.19%
Mortgage Type
New Conventional
Estimated Equity
$4,785
Purchase Details
Closed on
May 19, 2025
Sold by
Jackson Terry
Bought by
Vandelay Holdings Llc
Create a Home Valuation Report for This Property
The Home Valuation Report is an in-depth analysis detailing your home's value as well as a comparison with similar homes in the area
Home Values in the Area
Average Home Value in this Area
Purchase History
| Date | Buyer | Sale Price | Title Company |
|---|---|---|---|
| Cottingham Alexandria Leigh | $435,000 | -- | |
| Vandelay Holdings Llc | $167,500 | -- |
Source: Public Records
Mortgage History
| Date | Status | Borrower | Loan Amount |
|---|---|---|---|
| Open | Cottingham Alexandria Leigh | $413,250 |
Source: Public Records
Tax History
| Year | Tax Paid | Tax Assessment Tax Assessment Total Assessment is a certain percentage of the fair market value that is determined by local assessors to be the total taxable value of land and additions on the property. | Land | Improvement |
|---|---|---|---|---|
| 2025 | $2,690 | $93,080 | $28,000 | $65,080 |
| 2024 | $2,690 | $74,960 | $28,000 | $46,960 |
| 2023 | $1,416 | $57,040 | $15,000 | $42,040 |
| 2022 | $0 | $51,400 | $15,000 | $36,400 |
| 2021 | $0 | $38,120 | $6,000 | $32,120 |
| 2020 | $0 | $27,080 | $6,000 | $21,080 |
| 2019 | $0 | $27,080 | $6,000 | $21,080 |
| 2018 | $0 | $22,840 | $6,000 | $16,840 |
| 2017 | $0 | $15,840 | $5,800 | $10,040 |
| 2016 | -- | $14,880 | $5,800 | $9,080 |
| 2015 | $75 | $13,280 | $5,800 | $7,480 |
| 2014 | $152 | $12,080 | $0 | $0 |
Source: Public Records
Map
Nearby Homes
Your Personal Tour Guide
Ask me questions while you tour the home.