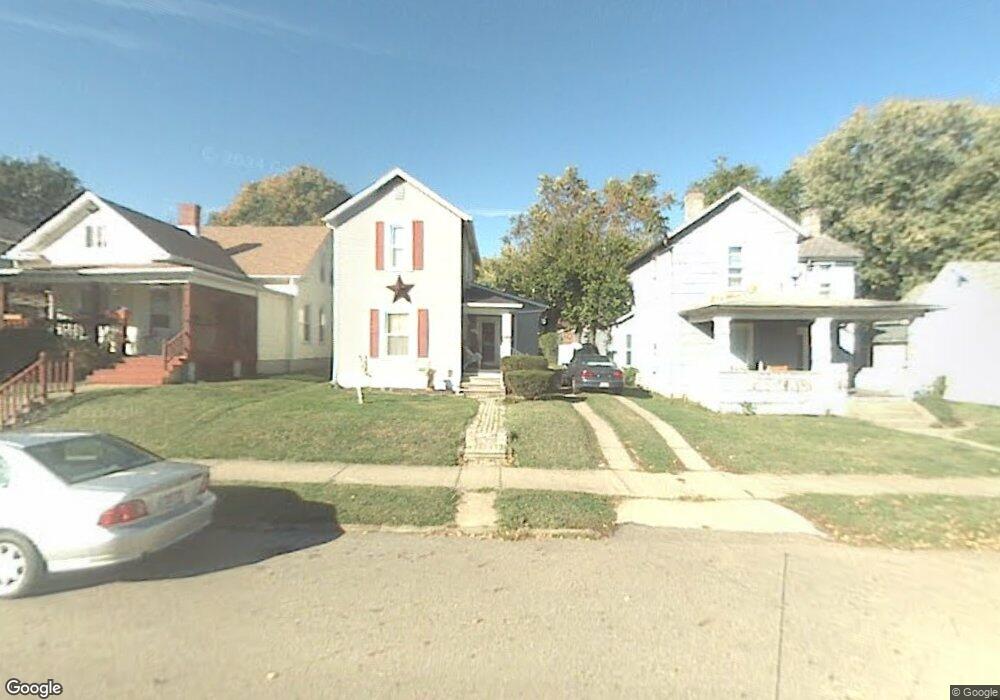
639 E Mulberry St Lancaster, OH 43130
Estimated Value: $194,613 - $232,000
2
Beds
2
Baths
980
Sq Ft
$213/Sq Ft
Est. Value
About This Home
This home is located at 639 E Mulberry St, Lancaster, OH 43130 and is currently estimated at $208,653, approximately $212 per square foot. 639 E Mulberry St is a home located in Fairfield County with nearby schools including Thomas Ewing Junior High School, Lancaster High School, and St Mary Elementary School.
Ownership History
Date
Name
Owned For
Owner Type
Purchase Details
Closed on
Jan 17, 2025
Sold by
Woltz Carol S and Woltz Jennifer
Bought by
Woltz Jennifer
Current Estimated Value
Home Financials for this Owner
Home Financials are based on the most recent Mortgage that was taken out on this home.
Original Mortgage
$73,000
Outstanding Balance
$72,199
Interest Rate
6.6%
Mortgage Type
New Conventional
Estimated Equity
$136,454
Purchase Details
Closed on
Apr 20, 2022
Sold by
Woltz Carol S
Bought by
Woltz Carol S and Woltz Jennifer
Purchase Details
Closed on
Sep 8, 1995
Sold by
Stalter Steven A
Bought by
Carol S Woltz
Home Financials for this Owner
Home Financials are based on the most recent Mortgage that was taken out on this home.
Original Mortgage
$61,250
Interest Rate
7.76%
Mortgage Type
New Conventional
Purchase Details
Closed on
Sep 2, 1993
Bought by
John Longest & Co
Purchase Details
Closed on
Aug 6, 1993
Sold by
Ashcraft Steve L
Bought by
John Longest & Co
Purchase Details
Closed on
Dec 1, 1987
Create a Home Valuation Report for This Property
The Home Valuation Report is an in-depth analysis detailing your home's value as well as a comparison with similar homes in the area
Home Values in the Area
Average Home Value in this Area
Purchase History
| Date | Buyer | Sale Price | Title Company |
|---|---|---|---|
| Woltz Jennifer | -- | States Title | |
| Woltz Carol S | -- | Holfinger Stevenson Law Firm L | |
| Carol S Woltz | $64,500 | -- | |
| John Longest & Co | $58,000 | -- | |
| John Longest & Co | $33,600 | -- | |
| -- | $34,000 | -- |
Source: Public Records
Mortgage History
| Date | Status | Borrower | Loan Amount |
|---|---|---|---|
| Open | Woltz Jennifer | $73,000 | |
| Previous Owner | Carol S Woltz | $61,250 |
Source: Public Records
Tax History
| Year | Tax Paid | Tax Assessment Tax Assessment Total Assessment is a certain percentage of the fair market value that is determined by local assessors to be the total taxable value of land and additions on the property. | Land | Improvement |
|---|---|---|---|---|
| 2024 | $4,028 | $44,810 | $8,760 | $36,050 |
| 2023 | $1,298 | $44,810 | $8,760 | $36,050 |
| 2022 | $1,319 | $44,810 | $8,760 | $36,050 |
| 2021 | $1,091 | $36,690 | $8,760 | $27,930 |
| 2020 | $350 | $36,690 | $8,760 | $27,930 |
| 2019 | $994 | $36,690 | $8,760 | $27,930 |
| 2018 | $236 | $28,890 | $8,760 | $20,130 |
| 2017 | $786 | $29,720 | $8,420 | $21,300 |
| 2016 | $766 | $29,720 | $8,420 | $21,300 |
Source: Public Records
Map
Nearby Homes
- 621 E Mulberry St
- 641 King St
- 619 E Main St
- 534 E Wheeling St
- 545 E Main St
- 538 E 6th Ave
- 0 Boyd St Unit 226002693
- 844 E Wheeling St
- 517 N Maple St
- 869 E Mulberry St
- 1006 King St
- 846 E Main St
- 632 N Eastwood Ave
- 721 Oakwood Ave
- 249 N Pearl Ave
- 701 Franklin Ave
- 627 Harding Ave
- 311 E Allen St
- 745 E Fair Ave
- 1106 E Walnut St
- 637 E Mulberry St
- 643 E Mulberry St
- 645 E Mulberry St
- 635 E Mulberry St
- 627 E Mulberry St
- 649 E Mulberry St
- 622 Isabell Ct
- 623 E Mulberry St
- 623 E Mulberry St Unit 43130
- 648 King St
- 644 King St
- 652 King St
- 640 King St
- 609 Isabelle Ct
- 638 E Mulberry St
- 609 Isabell Ct
- 636 E Mulberry St
- 640 E Mulberry St
- 634 E Mulberry St