M
Seller's Agent in 2024
MARCELENE EDWARDS
Dropped Members
(800) 218-4796
Estimated Value: $281,876 - $307,000
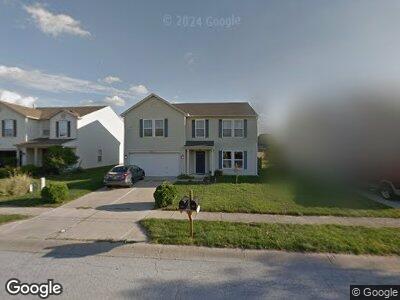
This home features a comfortable layout with good-sized bedrooms and bathrooms, a great kitchen with plenty of counter and cabinet space, many updated and upgraded features, central HVAC and programmable thermostat, garage and a spacious yard, and it's pet friendly.
| Date | Buyer | Sale Price | Title Company |
|---|---|---|---|
| Progress Residential Borrower 17 Llc | -- | None Available | |
| Progress Indianapolis Llc | $217,500 | None Available | |
| Walter William C | -- | Title Solutions Plus Corpora |
| Date | Status | Borrower | Loan Amount |
|---|---|---|---|
| Open | Progress Residential Borrower 17 Llc | $365,678,000 |
| Date | Event | Price | Change | Sq Ft Price |
|---|---|---|---|---|
| 01/03/2024 01/03/24 | Rented | $1,930 | -0.5% | -- |
| 12/11/2023 12/11/23 | Under Contract | -- | -- | -- |
| 12/07/2023 12/07/23 | Price Changed | $1,940 | +0.8% | $2 / Sq Ft |
| 12/06/2023 12/06/23 | Price Changed | $1,925 | +0.3% | $2 / Sq Ft |
| 12/05/2023 12/05/23 | Price Changed | $1,920 | +0.5% | $2 / Sq Ft |
| 12/04/2023 12/04/23 | Price Changed | $1,910 | -1.3% | $2 / Sq Ft |
| 12/01/2023 12/01/23 | Price Changed | $1,935 | -0.3% | $2 / Sq Ft |
| 11/30/2023 11/30/23 | Price Changed | $1,940 | -0.3% | $2 / Sq Ft |
| 11/29/2023 11/29/23 | Price Changed | $1,945 | -0.8% | $2 / Sq Ft |
| 11/28/2023 11/28/23 | Price Changed | $1,960 | +0.5% | $2 / Sq Ft |
| 11/27/2023 11/27/23 | Price Changed | $1,950 | -1.5% | $2 / Sq Ft |
| 11/22/2023 11/22/23 | Price Changed | $1,980 | -0.3% | $2 / Sq Ft |
| 11/21/2023 11/21/23 | Price Changed | $1,985 | +0.3% | $2 / Sq Ft |
| 11/20/2023 11/20/23 | Price Changed | $1,980 | -0.3% | $2 / Sq Ft |
| 11/16/2023 11/16/23 | Price Changed | $1,985 | +0.8% | $2 / Sq Ft |
| 11/15/2023 11/15/23 | Price Changed | $1,970 | -1.3% | $2 / Sq Ft |
| 11/14/2023 11/14/23 | Price Changed | $1,995 | -1.0% | $2 / Sq Ft |
| 11/13/2023 11/13/23 | For Rent | $2,015 | -- | -- |
| Year | Tax Paid | Tax Assessment Tax Assessment Total Assessment is a certain percentage of the fair market value that is determined by local assessors to be the total taxable value of land and additions on the property. | Land | Improvement |
|---|---|---|---|---|
| 2024 | $5,462 | $261,500 | $56,000 | $205,500 |
| 2023 | $5,343 | $256,200 | $56,000 | $200,200 |
| 2022 | $4,518 | $217,500 | $29,900 | $187,600 |
| 2021 | $3,955 | $189,600 | $29,900 | $159,700 |
| 2020 | $1,738 | $166,300 | $29,900 | $136,400 |
| 2019 | $1,633 | $156,400 | $29,900 | $126,500 |
| 2018 | $1,532 | $152,900 | $18,400 | $134,500 |
| 2017 | $1,468 | $146,800 | $18,400 | $128,400 |
| 2016 | $1,444 | $144,400 | $18,400 | $126,000 |
| 2014 | $1,359 | $135,900 | $22,500 | $113,400 |
| 2013 | $1,359 | $137,100 | $22,500 | $114,600 |
M
Seller's Agent in 2024
MARCELENE EDWARDS
Dropped Members
(800) 218-4796
