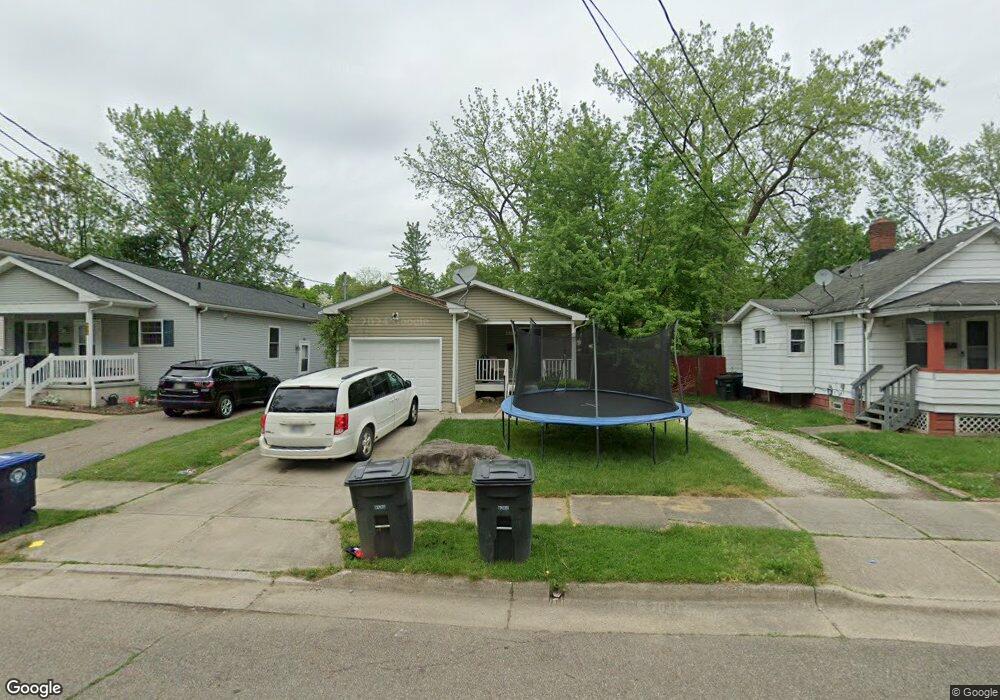
639 Hollibaugh Ave Akron, OH 44310
North Hill NeighborhoodEstimated Value: $134,112 - $149,000
3
Beds
2
Baths
984
Sq Ft
$144/Sq Ft
Est. Value
About This Home
This home is located at 639 Hollibaugh Ave, Akron, OH 44310 and is currently estimated at $142,028, approximately $144 per square foot. 639 Hollibaugh Ave is a home located in Summit County with nearby schools including North High School, Edge Academy, The, and Middlebury Academy.
Ownership History
Date
Name
Owned For
Owner Type
Purchase Details
Closed on
Apr 30, 2006
Sold by
Burton Roger A
Bought by
Mcbrearty Patrick J and Mcbrearty Stephanie A
Current Estimated Value
Home Financials for this Owner
Home Financials are based on the most recent Mortgage that was taken out on this home.
Original Mortgage
$103,062
Outstanding Balance
$59,757
Interest Rate
6.42%
Mortgage Type
FHA
Estimated Equity
$82,271
Create a Home Valuation Report for This Property
The Home Valuation Report is an in-depth analysis detailing your home's value as well as a comparison with similar homes in the area
Home Values in the Area
Average Home Value in this Area
Purchase History
| Date | Buyer | Sale Price | Title Company |
|---|---|---|---|
| Mcbrearty Patrick J | $104,680 | Title First Agency Inc |
Source: Public Records
Mortgage History
| Date | Status | Borrower | Loan Amount |
|---|---|---|---|
| Open | Mcbrearty Patrick J | $103,062 |
Source: Public Records
Tax History Compared to Growth
Tax History
| Year | Tax Paid | Tax Assessment Tax Assessment Total Assessment is a certain percentage of the fair market value that is determined by local assessors to be the total taxable value of land and additions on the property. | Land | Improvement |
|---|---|---|---|---|
| 2025 | $1,990 | $37,429 | $5,600 | $31,829 |
| 2024 | $1,990 | $37,429 | $5,600 | $31,829 |
| 2023 | $1,990 | $37,429 | $5,600 | $31,829 |
| 2022 | $1,949 | $28,792 | $4,309 | $24,483 |
| 2021 | $1,951 | $28,792 | $4,309 | $24,483 |
| 2020 | $1,921 | $28,790 | $4,310 | $24,480 |
| 2019 | $2,314 | $31,720 | $4,650 | $27,070 |
| 2018 | $2,283 | $31,720 | $4,650 | $27,070 |
| 2017 | $2,152 | $31,720 | $4,650 | $27,070 |
| 2016 | $2,154 | $29,360 | $4,650 | $24,710 |
| 2015 | $2,152 | $29,360 | $4,650 | $24,710 |
| 2014 | $2,135 | $29,360 | $4,650 | $24,710 |
| 2013 | $2,144 | $30,130 | $4,650 | $25,480 |
Source: Public Records
Map
Nearby Homes
- 630 Ranney St
- 523 Evans Ave
- 899 Davis St
- 553 Fouse Ave
- 868 Iredell St
- 855 Dan St
- 614 Parkview Ave
- 991 Nevin St
- 914 Dan St
- 389 E Glenwood Ave
- 335 Zeller Ave
- 472 E Tallmadge Ave
- 354 Zeller Ave
- 551 Oxford Ave
- 559 Patterson Ave
- 495 Delmar Ave
- 370 E Tallmadge Ave
- 354 Julien Ave
- 336 N Adams St
- 233 Arch St
- 643 Hollibaugh Ave
- 635 Hollibaugh Ave
- 631 Hollibaugh Ave
- 647 Hollibaugh Ave
- 616 Evans Ave
- 620 Evans Ave
- 629 Hollibaugh Ave
- 610 Evans Ave
- 642 Hollibaugh Ave
- 636 Hollibaugh Ave
- 625 Hollibaugh Ave
- 604 Evans Ave
- 632 Hollibaugh Ave
- 648 Hollibaugh Ave
- 632 Evans Ave
- 600 Evans Ave
- 628 Hollibaugh Ave
- 652 Hollibaugh Ave
- 619 Hollibaugh Ave
- 661 Hollibaugh Ave