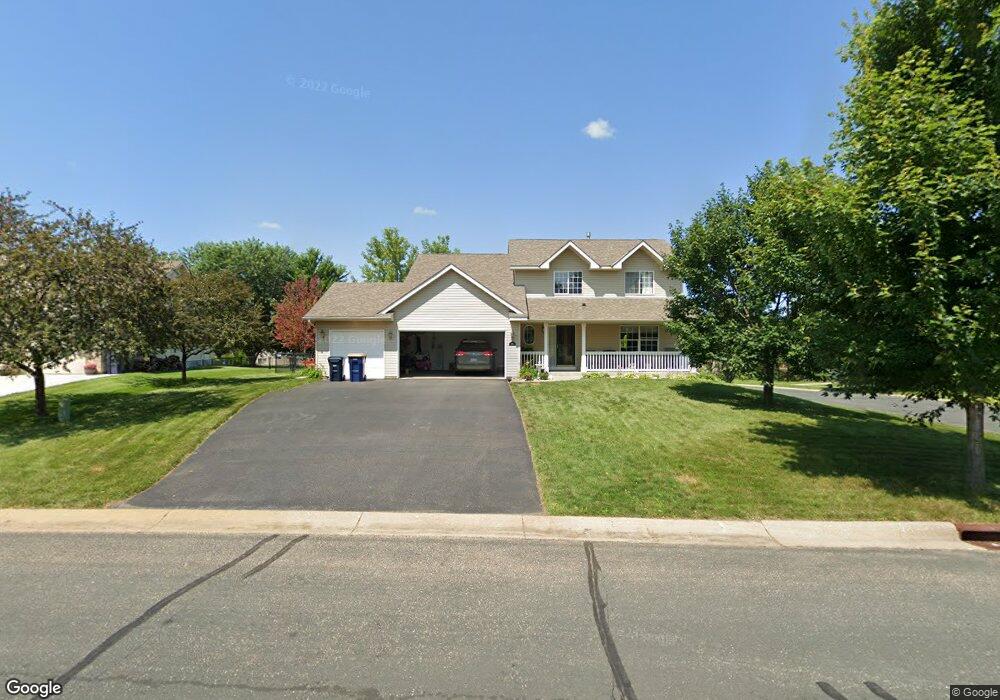
639 Lodge Dr Jordan, MN 55352
Estimated Value: $399,019 - $417,000
4
Beds
3
Baths
2,032
Sq Ft
$199/Sq Ft
Est. Value
About This Home
This home is located at 639 Lodge Dr, Jordan, MN 55352 and is currently estimated at $404,755, approximately $199 per square foot. 639 Lodge Dr is a home located in Scott County with nearby schools including Jordan Elementary School, Jordan Middle School, and Jordan High School.
Ownership History
Date
Name
Owned For
Owner Type
Purchase Details
Closed on
Apr 1, 2016
Sold by
Federal Home Loan Mortgage Corporation
Bought by
Salinas Miguel
Current Estimated Value
Home Financials for this Owner
Home Financials are based on the most recent Mortgage that was taken out on this home.
Original Mortgage
$212,148
Outstanding Balance
$169,582
Interest Rate
3.87%
Mortgage Type
FHA
Estimated Equity
$235,173
Purchase Details
Closed on
Jun 5, 2015
Sold by
Citimortgage Inc
Bought by
Federal Home Loan Mortgage Corporation
Purchase Details
Closed on
Mar 5, 2015
Sold by
Wormer Timothy and Wormer Jean
Bought by
Citimortgage Inc
Purchase Details
Closed on
Mar 28, 2003
Sold by
Watts Kraig A and Watts Deborah S
Bought by
Wormer Timothy and Wormer Jean
Purchase Details
Closed on
Jul 2, 1999
Sold by
Mesa Prop V
Bought by
Key-Land Homes
Purchase Details
Closed on
Dec 11, 1998
Sold by
Mary Hartman Construction
Bought by
Mesa Properties V Inc
Create a Home Valuation Report for This Property
The Home Valuation Report is an in-depth analysis detailing your home's value as well as a comparison with similar homes in the area
Home Values in the Area
Average Home Value in this Area
Purchase History
| Date | Buyer | Sale Price | Title Company |
|---|---|---|---|
| Salinas Miguel | -- | Scott County Abstract & Titl | |
| Federal Home Loan Mortgage Corporation | -- | Attorney | |
| Citimortgage Inc | $154,563 | None Available | |
| Wormer Timothy | $239,000 | -- | |
| Key-Land Homes | $34,500 | -- | |
| Watts Kraig A | $176,522 | -- | |
| Mesa Properties V Inc | $1,221,760 | -- |
Source: Public Records
Mortgage History
| Date | Status | Borrower | Loan Amount |
|---|---|---|---|
| Open | Salinas Miguel | $212,148 |
Source: Public Records
Tax History Compared to Growth
Tax History
| Year | Tax Paid | Tax Assessment Tax Assessment Total Assessment is a certain percentage of the fair market value that is determined by local assessors to be the total taxable value of land and additions on the property. | Land | Improvement |
|---|---|---|---|---|
| 2025 | $4,810 | $393,500 | $104,600 | $288,900 |
| 2024 | $4,376 | $387,300 | $101,600 | $285,700 |
| 2023 | $4,066 | $340,900 | $93,200 | $247,700 |
| 2022 | $4,166 | $342,400 | $93,200 | $249,200 |
| 2021 | $4,166 | $291,000 | $87,100 | $203,900 |
| 2020 | $4,132 | $289,600 | $84,600 | $205,000 |
| 2019 | $4,270 | $280,400 | $78,400 | $202,000 |
| 2018 | $4,114 | $0 | $0 | $0 |
| 2016 | $4,376 | $0 | $0 | $0 |
| 2014 | -- | $0 | $0 | $0 |
Source: Public Records
Map
Nearby Homes
- 6305 X 46A W 190th St
- 6305 W 190th St
- 6305 W 190th 15c St
- 4X Valley View Dr
- 6X Valley View Dr
- 2X Valley View Dr
- 1X Valley View Dr
- 5X Valley View Dr
- 1X Highway 169
- 18129 E Sioux Vista Dr
- 712 Syndicate St
- 1XX Highway 169
- 509 Varner St N
- 109 2nd St E
- 1258 Beaumont Blvd
- 1266 Beaumont Blvd
- 1295 Beaumont Blvd
- 1259 Highland Ln
- Bradley Plan at Beaumont Bluffs - Carriage Collection
- Everett Plan at Beaumont Bluffs - Carriage Collection
- 635 Lodge Dr
- 703 Lodge Dr
- 631 Lodge Dr
- 640 Heritage Trail
- 636 Heritage Trail
- 632 Heritage Trail
- 634 Lodge Dr
- 707 Lodge Dr
- 700 Heritage Trail
- 627 Lodge Dr
- 702 Lodge Dr
- 630 Lodge Dr
- 628 Heritage Trail
- 704 Heritage Trail
- 711 Lodge Dr
- 626 Lodge Dr
- 624 Heritage Trail
- 623 Lodge Dr
- 706 Lodge Dr
- 708 Heritage Trail