Estimated Value: $89,079 - $119,000
2
Beds
1
Bath
725
Sq Ft
$144/Sq Ft
Est. Value
About This Home
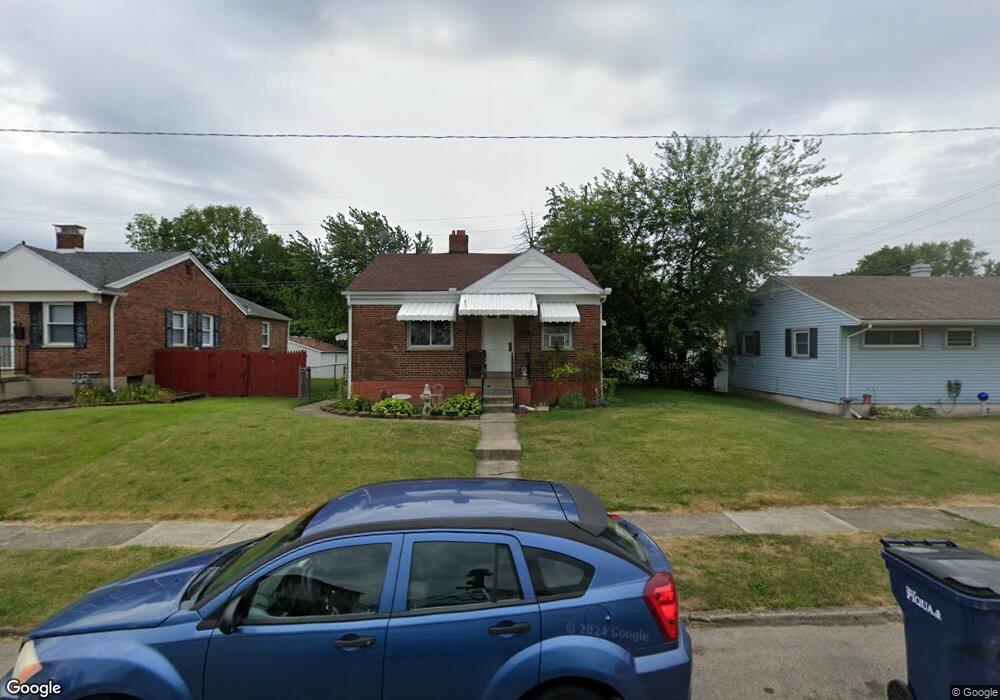
This home is located at 639 Manier Ave, Piqua, OH 45356 and is currently estimated at $104,270, approximately $143 per square foot. 639 Manier Ave is a home located in Miami County with nearby schools including Piqua Junior High School, Piqua High School, and Nicholas School.
Ownership History
Date
Name
Owned For
Owner Type
Purchase Details
Closed on
Mar 21, 2005
Sold by
Anderson Jason L
Bought by
Wright Steve and Wright Donna
Current Estimated Value
Purchase Details
Closed on
Sep 3, 1999
Sold by
Rhynard Jodi L
Bought by
Anderson Jason L
Home Financials for this Owner
Home Financials are based on the most recent Mortgage that was taken out on this home.
Original Mortgage
$58,576
Interest Rate
7.59%
Mortgage Type
FHA
Purchase Details
Closed on
Oct 16, 1992
Bought by
Rhynard Jodi L
Create a Home Valuation Report for This Property
The Home Valuation Report is an in-depth analysis detailing your home's value as well as a comparison with similar homes in the area
Home Values in the Area
Average Home Value in this Area
Purchase History
| Date | Buyer | Sale Price | Title Company |
|---|---|---|---|
| Wright Steve | $55,000 | -- | |
| Anderson Jason L | $58,607 | -- | |
| Rhynard Jodi L | $35,000 | -- |
Source: Public Records
Mortgage History
| Date | Status | Borrower | Loan Amount |
|---|---|---|---|
| Previous Owner | Anderson Jason L | $58,576 |
Source: Public Records
Tax History Compared to Growth
Tax History
| Year | Tax Paid | Tax Assessment Tax Assessment Total Assessment is a certain percentage of the fair market value that is determined by local assessors to be the total taxable value of land and additions on the property. | Land | Improvement |
|---|---|---|---|---|
| 2024 | $757 | $17,960 | $6,760 | $11,200 |
| 2023 | $757 | $17,960 | $6,760 | $11,200 |
| 2022 | $770 | $17,960 | $6,760 | $11,200 |
| 2021 | $622 | $13,310 | $5,010 | $8,300 |
| 2020 | $612 | $13,310 | $5,010 | $8,300 |
| 2019 | $615 | $13,310 | $5,010 | $8,300 |
| 2018 | $672 | $13,860 | $5,040 | $8,820 |
| 2017 | $680 | $13,860 | $5,040 | $8,820 |
| 2016 | $673 | $13,860 | $5,040 | $8,820 |
| 2015 | $661 | $13,300 | $4,830 | $8,470 |
| 2014 | $661 | $13,300 | $4,830 | $8,470 |
| 2013 | $663 | $13,300 | $4,830 | $8,470 |
Source: Public Records
Map
Nearby Homes