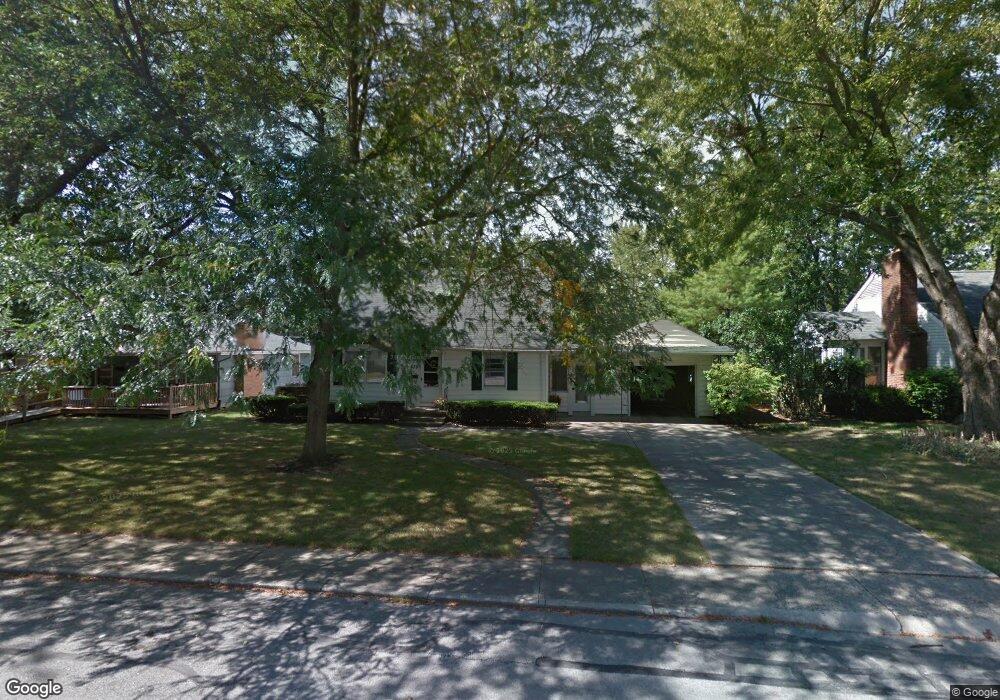
639 Maple St Celina, OH 45822
Estimated Value: $113,000 - $187,838
4
Beds
1
Bath
1,142
Sq Ft
$120/Sq Ft
Est. Value
About This Home
This home is located at 639 Maple St, Celina, OH 45822 and is currently estimated at $137,460, approximately $120 per square foot. 639 Maple St is a home located in Mercer County with nearby schools including Celina Middle School, Celina High School, and Immaculate Conception School.
Ownership History
Date
Name
Owned For
Owner Type
Purchase Details
Closed on
Aug 8, 2025
Sold by
Fortkamp Sharon Ann and Tadiello Barbara Kay
Bought by
Rutledge Gregg A and Rutledge Kristen J
Current Estimated Value
Home Financials for this Owner
Home Financials are based on the most recent Mortgage that was taken out on this home.
Original Mortgage
$160,000
Outstanding Balance
$159,893
Interest Rate
8%
Mortgage Type
New Conventional
Estimated Equity
-$22,433
Purchase Details
Closed on
Aug 19, 2003
Bought by
Brandts Clayton Eugene
Create a Home Valuation Report for This Property
The Home Valuation Report is an in-depth analysis detailing your home's value as well as a comparison with similar homes in the area
Home Values in the Area
Average Home Value in this Area
Purchase History
| Date | Buyer | Sale Price | Title Company |
|---|---|---|---|
| Rutledge Gregg A | $134,166 | None Listed On Document | |
| Brandts Clayton Eugene | -- | -- |
Source: Public Records
Mortgage History
| Date | Status | Borrower | Loan Amount |
|---|---|---|---|
| Open | Rutledge Gregg A | $160,000 |
Source: Public Records
Tax History
| Year | Tax Paid | Tax Assessment Tax Assessment Total Assessment is a certain percentage of the fair market value that is determined by local assessors to be the total taxable value of land and additions on the property. | Land | Improvement |
|---|---|---|---|---|
| 2025 | $2,078 | $52,720 | $10,400 | $42,320 |
| 2024 | $2,085 | $52,720 | $10,400 | $42,320 |
| 2023 | $2,078 | $52,720 | $10,400 | $42,320 |
| 2022 | $1,892 | $41,900 | $6,650 | $35,250 |
| 2021 | $1,897 | $41,900 | $6,650 | $35,250 |
| 2020 | $1,589 | $41,900 | $6,650 | $35,250 |
| 2019 | $1,393 | $34,450 | $5,780 | $28,670 |
| 2018 | $1,448 | $34,450 | $5,780 | $28,670 |
| 2017 | $1,320 | $34,450 | $5,780 | $28,670 |
| 2016 | $1,192 | $28,700 | $6,370 | $22,330 |
| 2015 | $1,156 | $28,670 | $6,370 | $22,300 |
| 2014 | $1,159 | $28,670 | $6,370 | $22,300 |
| 2013 | $1,119 | $26,050 | $5,780 | $20,270 |
Source: Public Records
Map
Nearby Homes
- 314 Magnolia St
- 206 Magnolia St
- 316 Dogwood Dr
- 1021 Hemlock St
- 680 N Main St
- 120 E Blake St
- 545 E Anthony St
- 1109 Shimp Dr
- 115 Touvelle St
- 1018 Lilac St
- 328 E Livingston St
- 1201 Lilac Dr
- 906 N Sugar St
- 908 N Sugar St
- 1001 N Sugar St
- 319 E Fayette St
- 802 E Market St
- 630 N Brandon Ave
- 0 Grand Lake Rd
- 1014 Chicory Ct
Your Personal Tour Guide
Ask me questions while you tour the home.