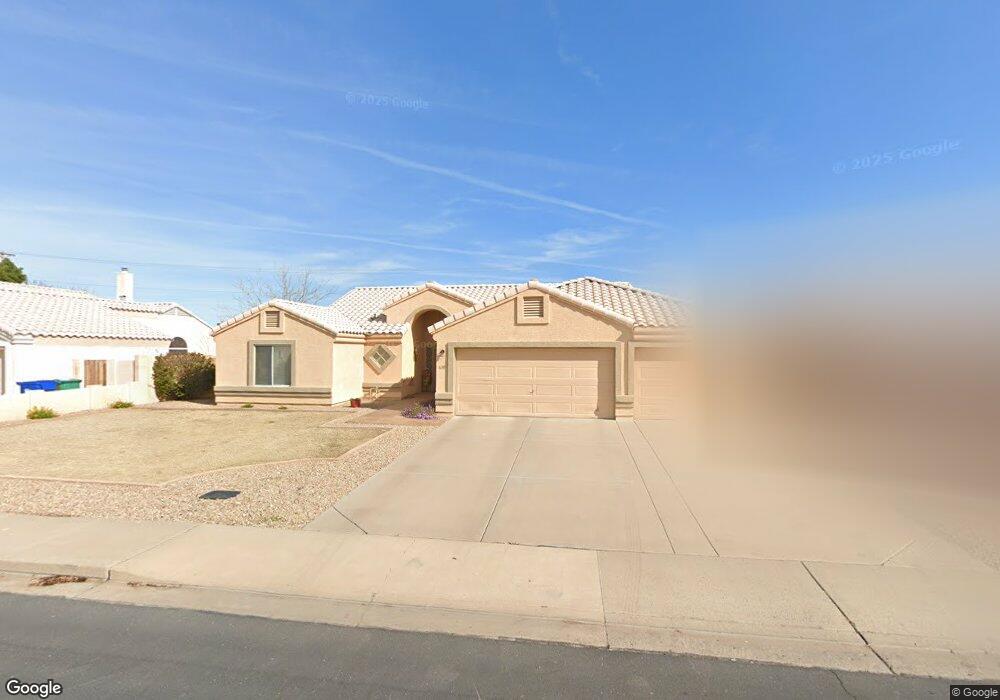
639 N Almar Mesa, AZ 85213
The Groves NeighborhoodEstimated Value: $475,009 - $555,000
--
Bed
3
Baths
1,898
Sq Ft
$278/Sq Ft
Est. Value
About This Home
This home is located at 639 N Almar, Mesa, AZ 85213 and is currently estimated at $528,502, approximately $278 per square foot. 639 N Almar is a home located in Maricopa County with nearby schools including Highland Elementary School, Franklin at Brimhall Elementary School, and Franklin West Elementary School.
Ownership History
Date
Name
Owned For
Owner Type
Purchase Details
Closed on
Mar 23, 2021
Sold by
Lipovsky Larry G and Lipovsky Linda
Bought by
Lipovsky Larry G and Lipovsky Linda
Current Estimated Value
Purchase Details
Closed on
Apr 1, 2003
Sold by
Lipovsky Larry G and Lipovsky Linda
Bought by
Lipovsky Larry G and Lipovsky Linda
Home Financials for this Owner
Home Financials are based on the most recent Mortgage that was taken out on this home.
Original Mortgage
$148,000
Interest Rate
5.78%
Create a Home Valuation Report for This Property
The Home Valuation Report is an in-depth analysis detailing your home's value as well as a comparison with similar homes in the area
Home Values in the Area
Average Home Value in this Area
Purchase History
| Date | Buyer | Sale Price | Title Company |
|---|---|---|---|
| Lipovsky Larry G | -- | None Available | |
| Lipovsky Larry G | -- | Transnation Title Insurance |
Source: Public Records
Mortgage History
| Date | Status | Borrower | Loan Amount |
|---|---|---|---|
| Closed | Lipovsky Larry G | $148,000 |
Source: Public Records
Tax History Compared to Growth
Tax History
| Year | Tax Paid | Tax Assessment Tax Assessment Total Assessment is a certain percentage of the fair market value that is determined by local assessors to be the total taxable value of land and additions on the property. | Land | Improvement |
|---|---|---|---|---|
| 2025 | $2,017 | $24,289 | -- | -- |
| 2024 | $2,039 | $23,132 | -- | -- |
| 2023 | $2,039 | $37,620 | $7,520 | $30,100 |
| 2022 | $1,994 | $30,110 | $6,020 | $24,090 |
| 2021 | $2,049 | $28,760 | $5,750 | $23,010 |
| 2020 | $2,022 | $26,820 | $5,360 | $21,460 |
| 2019 | $1,873 | $24,860 | $4,970 | $19,890 |
| 2018 | $1,788 | $23,400 | $4,680 | $18,720 |
| 2017 | $1,732 | $21,850 | $4,370 | $17,480 |
| 2016 | $1,701 | $21,960 | $4,390 | $17,570 |
| 2015 | $1,606 | $20,920 | $4,180 | $16,740 |
Source: Public Records
Map
Nearby Homes
- 3228 E Dover St
- 3203 E Ellis St
- 3046 E Dover St
- 3422 E University Dr Unit 17
- 3464 E Decatur St
- 3059 E Camino St
- 3020 E Des Moines St
- 3165 E University Dr Unit 718
- 3165 E University Dr Unit 403
- 3620 E Dover St
- 3345 E University Dr Unit 72
- 3345 E University Dr Unit 39
- 3345 E University Dr Unit 28
- 3508 E Encanto St
- 525 N Val Vista Dr Unit 21
- 526 N Merino
- 3716 E University Dr Unit 2030
- 3716 E University Dr Unit 2014
- 3716 E University Dr Unit C2010
- 120 N Val Vista Dr Unit 139
- 631 N Almar
- 645 N Almar
- 623 N Almar
- 640 N Almar
- 651 N Almar
- 646 N Almar
- 615 N Almar Cir
- 659 N Almar
- 3246 E Dover St
- 3239 E Des Moines St
- 614 N Almar Cir
- 3311 E Dartmouth St
- 609 N Almar Cir
- 3234 E Dover St
- 665 N Almar
- 3222 E Dover St
- 3227 E Des Moines St
- 3336 E Dover Cir
- 606 N Almar Cir
- 3245 E Dover St