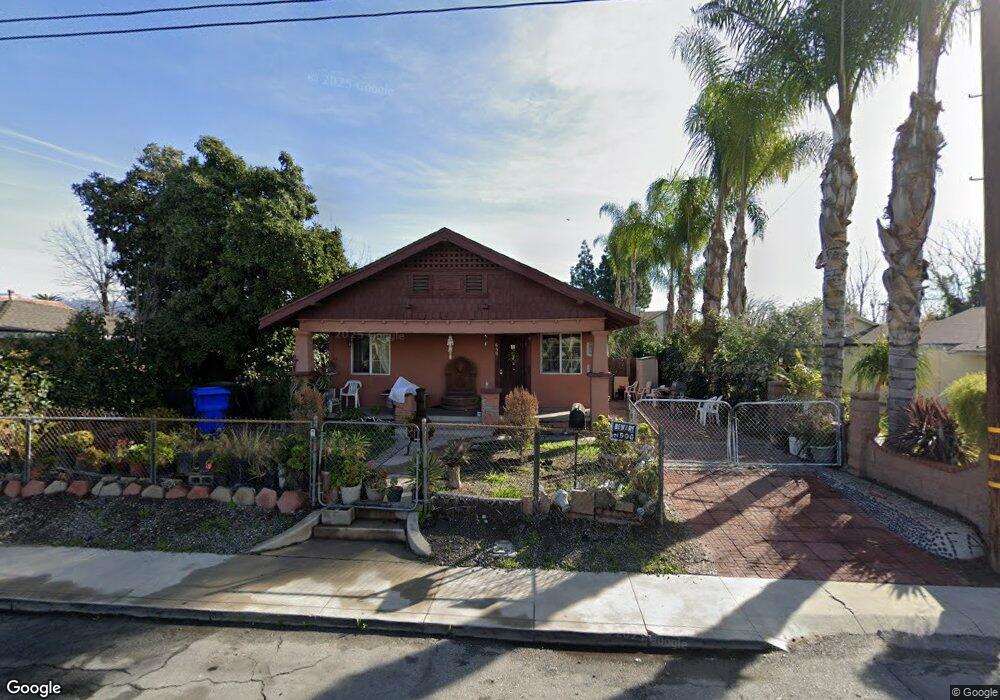
639 Perris St San Bernardino, CA 92411
La Plaza NeighborhoodEstimated Value: $314,000 - $490,000
1
Bed
1
Bath
1,794
Sq Ft
$209/Sq Ft
Est. Value
About This Home
This home is located at 639 Perris St, San Bernardino, CA 92411 and is currently estimated at $374,947, approximately $209 per square foot. 639 Perris St is a home located in San Bernardino County with nearby schools including Mt. Vernon Elementary School, Dr. Martin Luther King Jr. Middle School, and Arroyo Valley High School.
Ownership History
Date
Name
Owned For
Owner Type
Purchase Details
Closed on
Jan 11, 2013
Sold by
Torres Magdalena
Bought by
Spssm Investments Viii Lp
Current Estimated Value
Purchase Details
Closed on
Apr 12, 2001
Sold by
Second Samoan Congregational Church Long
Bought by
Torres Magdalena
Home Financials for this Owner
Home Financials are based on the most recent Mortgage that was taken out on this home.
Original Mortgage
$71,872
Interest Rate
7.14%
Mortgage Type
FHA
Purchase Details
Closed on
May 2, 2000
Sold by
Hud
Bought by
Second Samoan Congregational Church Of L
Home Financials for this Owner
Home Financials are based on the most recent Mortgage that was taken out on this home.
Original Mortgage
$36,000
Interest Rate
8.15%
Purchase Details
Closed on
Sep 24, 1998
Sold by
Peralez Jessie Lee
Bought by
Norwest Mtg Inc
Purchase Details
Closed on
Sep 4, 1998
Sold by
Norwest Mtg Inc
Bought by
Hud
Purchase Details
Closed on
Mar 11, 1997
Sold by
Continental Termite & Investment Corp
Bought by
Peralez Jessie Lee
Home Financials for this Owner
Home Financials are based on the most recent Mortgage that was taken out on this home.
Original Mortgage
$69,950
Interest Rate
7.96%
Mortgage Type
FHA
Purchase Details
Closed on
Nov 5, 1996
Sold by
Rojas Ruth
Bought by
Rojas Cenobio
Home Financials for this Owner
Home Financials are based on the most recent Mortgage that was taken out on this home.
Original Mortgage
$21,200
Interest Rate
7.67%
Purchase Details
Closed on
Apr 24, 1996
Sold by
Fleet Real Estate Funding Corp
Bought by
Hud
Purchase Details
Closed on
Feb 9, 1996
Sold by
Fernandez Fernando and Fernandez Alicia
Bought by
Fleet Real Estate Funding Corp
Create a Home Valuation Report for This Property
The Home Valuation Report is an in-depth analysis detailing your home's value as well as a comparison with similar homes in the area
Home Values in the Area
Average Home Value in this Area
Purchase History
| Date | Buyer | Sale Price | Title Company |
|---|---|---|---|
| Spssm Investments Viii Lp | $40,000 | None Available | |
| Torres Magdalena | $73,000 | Ticor Title | |
| Second Samoan Congregational Church Of L | $27,500 | Fidelity National Title Co | |
| Norwest Mtg Inc | $74,678 | Ati Title Company | |
| Hud | -- | Ati Title Company | |
| Peralez Jessie Lee | $70,000 | First American Title Ins Co | |
| Continental Termite & Investment Corp | -- | First American Title Ins Co | |
| Rojas Cenobio | -- | First Southwestern Title Co | |
| Rojas Cenobio | $25,000 | First Southwestern Title Co | |
| Hud | -- | First Southwestern Title Co | |
| Fleet Real Estate Funding Corp | $63,433 | First Southwestern Title Co |
Source: Public Records
Mortgage History
| Date | Status | Borrower | Loan Amount |
|---|---|---|---|
| Previous Owner | Torres Magdalena | $71,872 | |
| Previous Owner | Second Samoan Congregational Church Of L | $36,000 | |
| Previous Owner | Peralez Jessie Lee | $69,950 | |
| Previous Owner | Rojas Cenobio | $21,200 |
Source: Public Records
Tax History Compared to Growth
Tax History
| Year | Tax Paid | Tax Assessment Tax Assessment Total Assessment is a certain percentage of the fair market value that is determined by local assessors to be the total taxable value of land and additions on the property. | Land | Improvement |
|---|---|---|---|---|
| 2025 | $1,081 | $252,886 | $22,166 | $230,720 |
| 2024 | $1,081 | $72,437 | $21,731 | $50,706 |
| 2023 | $1,054 | $71,017 | $21,305 | $49,712 |
| 2022 | $1,052 | $69,624 | $20,887 | $48,737 |
| 2021 | $1,050 | $68,258 | $20,477 | $47,781 |
| 2020 | $1,049 | $67,558 | $20,267 | $47,291 |
| 2019 | $1,021 | $66,234 | $19,870 | $46,364 |
| 2018 | $1,011 | $64,935 | $19,480 | $45,455 |
| 2017 | $980 | $63,662 | $19,098 | $44,564 |
| 2016 | $951 | $62,414 | $18,724 | $43,690 |
| 2015 | $818 | $61,477 | $18,443 | $43,034 |
| 2014 | $795 | $60,273 | $18,082 | $42,191 |
Source: Public Records
Map
Nearby Homes