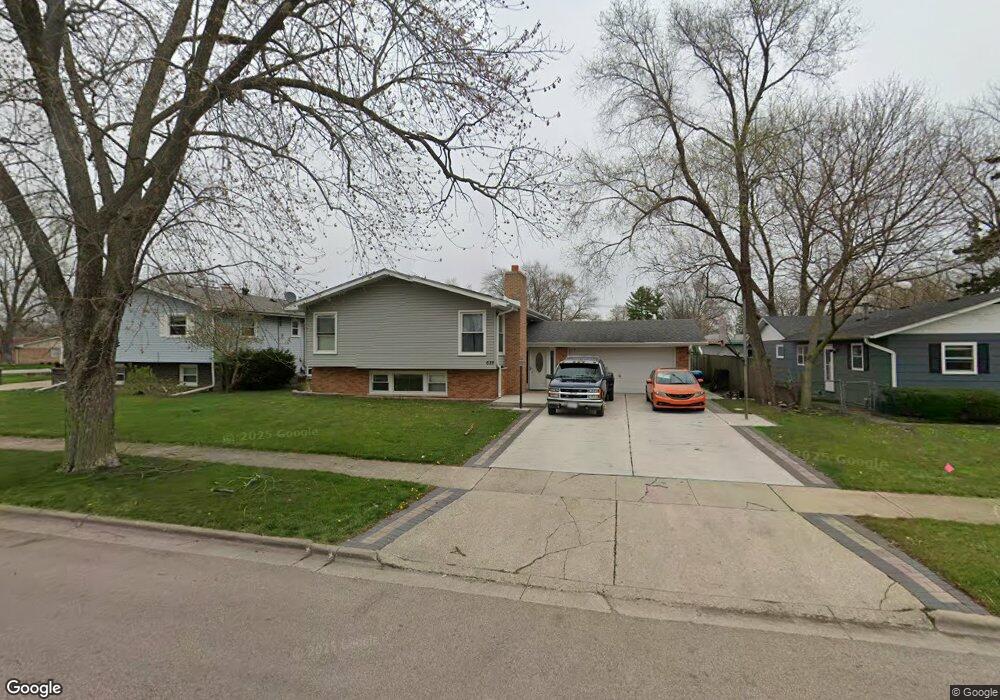
639 Seneca Dr Aurora, IL 60506
Blackhawk NeighborhoodEstimated Value: $308,872 - $349,000
--
Bed
1
Bath
2,478
Sq Ft
$133/Sq Ft
Est. Value
About This Home
This home is located at 639 Seneca Dr, Aurora, IL 60506 and is currently estimated at $329,468, approximately $132 per square foot. 639 Seneca Dr is a home located in Kane County with nearby schools including Mccleery Elementary School, Jefferson Middle School, and West Aurora High School.
Ownership History
Date
Name
Owned For
Owner Type
Purchase Details
Closed on
Jun 7, 2016
Sold by
Farfan Pedro L
Bought by
Olalde Elida
Current Estimated Value
Purchase Details
Closed on
Jul 2, 2003
Sold by
Cordova Juan and Cordova Alma
Bought by
Farfan Pedro L and Olalde Elida
Home Financials for this Owner
Home Financials are based on the most recent Mortgage that was taken out on this home.
Original Mortgage
$176,234
Interest Rate
5.37%
Mortgage Type
FHA
Purchase Details
Closed on
Apr 22, 1998
Sold by
Gretbanc Trust Company
Bought by
Cordova Juan and Cordova Alma
Home Financials for this Owner
Home Financials are based on the most recent Mortgage that was taken out on this home.
Original Mortgage
$123,466
Interest Rate
7.2%
Mortgage Type
FHA
Purchase Details
Closed on
Jun 1, 1995
Sold by
Durbin James J
Bought by
Durbin Anita T
Create a Home Valuation Report for This Property
The Home Valuation Report is an in-depth analysis detailing your home's value as well as a comparison with similar homes in the area
Home Values in the Area
Average Home Value in this Area
Purchase History
| Date | Buyer | Sale Price | Title Company |
|---|---|---|---|
| Olalde Elida | -- | First American Title Ins Co | |
| Farfan Pedro L | $179,000 | First American Title | |
| Cordova Juan | $125,000 | Law Title Insurance Co Inc | |
| Durbin Anita T | -- | -- |
Source: Public Records
Mortgage History
| Date | Status | Borrower | Loan Amount |
|---|---|---|---|
| Previous Owner | Farfan Pedro L | $176,234 | |
| Previous Owner | Cordova Juan | $123,466 |
Source: Public Records
Tax History Compared to Growth
Tax History
| Year | Tax Paid | Tax Assessment Tax Assessment Total Assessment is a certain percentage of the fair market value that is determined by local assessors to be the total taxable value of land and additions on the property. | Land | Improvement |
|---|---|---|---|---|
| 2024 | $6,289 | $87,424 | $13,876 | $73,548 |
| 2023 | $6,005 | $78,113 | $12,398 | $65,715 |
| 2022 | $5,778 | $71,271 | $11,312 | $59,959 |
| 2021 | $6,447 | $76,561 | $10,532 | $66,029 |
| 2020 | $6,096 | $71,114 | $9,783 | $61,331 |
| 2019 | $6,032 | $67,682 | $9,064 | $58,618 |
| 2018 | $5,494 | $60,934 | $8,384 | $52,550 |
| 2017 | $5,677 | $61,159 | $7,725 | $53,434 |
| 2016 | $4,916 | $52,277 | $6,622 | $45,655 |
| 2015 | -- | $45,564 | $5,694 | $39,870 |
| 2014 | -- | $42,210 | $5,233 | $36,977 |
| 2013 | -- | $42,125 | $5,674 | $36,451 |
Source: Public Records
Map
Nearby Homes
- 1351 Monomoy St Unit D
- 1104 New Haven Ave
- 1389 Monomoy St Unit B2
- 833 N Randall Rd Unit C4
- 1390 N Glen Cir Unit B
- 630 N Buell Ave
- 781 N Elmwood Dr
- 795 N Elmwood Dr
- 943 Charles St
- 616 Morton Ave
- 972 Westgate Dr
- 900 Charles St
- 1296 Yellowpine Dr
- 930 W New York St Unit 932
- 231 W Downer Place
- 113 Stonewood Place Unit 6D
- 1035 Newcastle Ln
- 1747 W Illinois Ave
- 809 W Park Ave
- 1543 W Downer Place
- 645 Seneca Dr Unit 2
- 638 Iroquois Dr Unit 2
- 632 Iroquois Dr
- 1236 W Illinois Ave Unit 2
- 629 Seneca Dr
- 644 Seneca Dr
- 626 Iroquois Dr Unit 2
- 636 Seneca Dr
- 625 Seneca Dr
- 620 Iroquois Dr
- 1306 W Illinois Ave
- 1305 Monona Ave Unit 3
- 621 Seneca Dr
- 614 Iroquois Dr
- 641 Iroquois Dr
- 635 Iroquois Dr
- 645 Iroquois Dr
- 1310 W Illinois Ave
- 610 Iroquois Dr
- 1309 Monona Ave