6396 Raleigh St Unit 2903 Orlando, FL 32835
MetroWest NeighborhoodEstimated Value: $191,000 - $200,000
2
Beds
2
Baths
1,051
Sq Ft
$186/Sq Ft
Est. Value
About This Home
This home is located at 6396 Raleigh St Unit 2903, Orlando, FL 32835 and is currently estimated at $195,204, approximately $185 per square foot. 6396 Raleigh St Unit 2903 is a home located in Orange County with nearby schools including Westpointe Elementary, Chain of Lakes Middle School, and Olympia High.
Ownership History
Date
Name
Owned For
Owner Type
Purchase Details
Closed on
Jun 10, 2016
Sold by
Craig David and Craig Kylie Ann
Bought by
Conchiglia Kristen Anne
Current Estimated Value
Home Financials for this Owner
Home Financials are based on the most recent Mortgage that was taken out on this home.
Original Mortgage
$76,800
Outstanding Balance
$61,303
Interest Rate
3.66%
Mortgage Type
New Conventional
Estimated Equity
$133,901
Purchase Details
Closed on
Dec 9, 2010
Sold by
Aurora Loan Services Llc
Bought by
Craig David and Craig Kylie Ann
Purchase Details
Closed on
Aug 17, 2010
Sold by
Labruzzo Tara
Bought by
Aurora Loan Services Llc
Purchase Details
Closed on
Jun 28, 2006
Sold by
The Azur At Metrowest Llc
Bought by
Labruzzo Tara
Home Financials for this Owner
Home Financials are based on the most recent Mortgage that was taken out on this home.
Original Mortgage
$159,680
Interest Rate
6.75%
Mortgage Type
Purchase Money Mortgage
Create a Home Valuation Report for This Property
The Home Valuation Report is an in-depth analysis detailing your home's value as well as a comparison with similar homes in the area
Home Values in the Area
Average Home Value in this Area
Purchase History
| Date | Buyer | Sale Price | Title Company |
|---|---|---|---|
| Conchiglia Kristen Anne | $96,000 | Attorney | |
| Craig David | $47,000 | Attorney | |
| Aurora Loan Services Llc | -- | None Available | |
| Labruzzo Tara | $199,600 | Sunbelt Title Agency |
Source: Public Records
Mortgage History
| Date | Status | Borrower | Loan Amount |
|---|---|---|---|
| Open | Conchiglia Kristen Anne | $76,800 | |
| Previous Owner | Labruzzo Tara | $159,680 |
Source: Public Records
Tax History Compared to Growth
Tax History
| Year | Tax Paid | Tax Assessment Tax Assessment Total Assessment is a certain percentage of the fair market value that is determined by local assessors to be the total taxable value of land and additions on the property. | Land | Improvement |
|---|---|---|---|---|
| 2025 | $1,596 | $129,982 | -- | -- |
| 2024 | $1,511 | $129,982 | -- | -- |
| 2023 | $1,511 | $122,640 | $0 | $0 |
| 2022 | $1,452 | $119,068 | $0 | $0 |
| 2021 | $1,415 | $115,600 | $23,120 | $92,480 |
| 2020 | $1,965 | $108,300 | $21,660 | $86,640 |
| 2019 | $1,947 | $105,100 | $21,020 | $84,080 |
| 2018 | $1,763 | $91,400 | $18,280 | $73,120 |
| 2017 | $1,613 | $82,000 | $16,400 | $65,600 |
| 2016 | $1,416 | $77,400 | $15,480 | $61,920 |
| 2015 | $1,326 | $71,100 | $14,220 | $56,880 |
| 2014 | $1,281 | $71,100 | $14,220 | $56,880 |
Source: Public Records
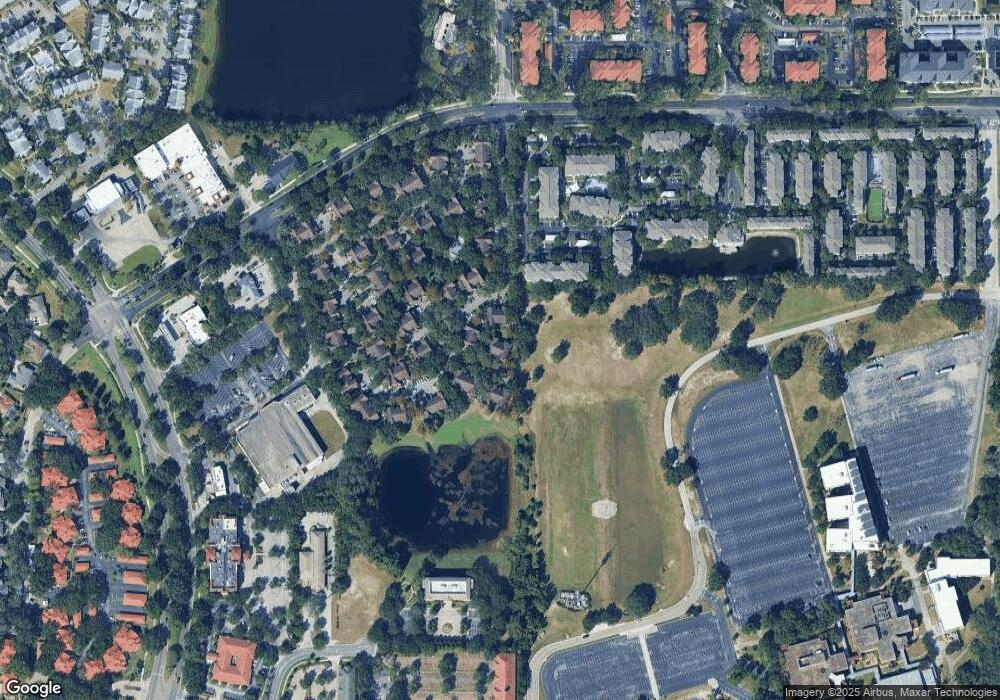
Map
Nearby Homes
- 6416 Raleigh St Unit 2614
- 6412 Raleigh St Unit 2504
- 6320 Raleigh St Unit 604
- 6408 Raleigh St Unit 2403
- 6424 Raleigh St Unit 3114
- 6348 Raleigh St Unit 1311
- 6316 Raleigh St Unit 401
- 6324 Raleigh St Unit 712
- 6356 Raleigh St Unit 1503
- 6384 Raleigh St Unit 2216
- 6384 Raleigh St Unit 2214
- 6312 Raleigh St Unit 513
- 6304 Raleigh St Unit 204
- 6340 Raleigh St Unit 1001
- 1079 S Hiawassee Rd Unit 1127
- 1071 S Hiawassee Rd Unit 1214
- 1071 S Hiawassee Rd Unit 1211
- 1071 S Hiawassee Rd Unit 1213
- 1069 S Hiawassee Rd Unit 1317
- 1077 S Hiawassee Rd Unit 813
- 6396 Raleigh St
- 6396 Raleigh St Unit 110
- 6396 Raleigh St Unit 2913
- 6396 Raleigh St Unit 2912
- 6396 Raleigh St Unit 2911
- 6396 Raleigh St Unit 2915
- 6396 Raleigh St Unit 2914
- 6396 Raleigh St Unit 2902
- 6396 Raleigh St Unit 2904
- 6396 Raleigh St
- 6400 Raleigh St Unit 3012
- 6400 Raleigh St Unit 3003
- 6400 Raleigh St Unit 3002
- 6400 Raleigh St Unit 3014
- 6400 Raleigh St Unit 3011
- 6400 Raleigh St Unit 3004
- 6400 Raleigh St Unit 3001
- 6400 Raleigh St Unit 3013
- 6424 Raleigh St Unit 3102
- 6424 Raleigh St Unit 3113