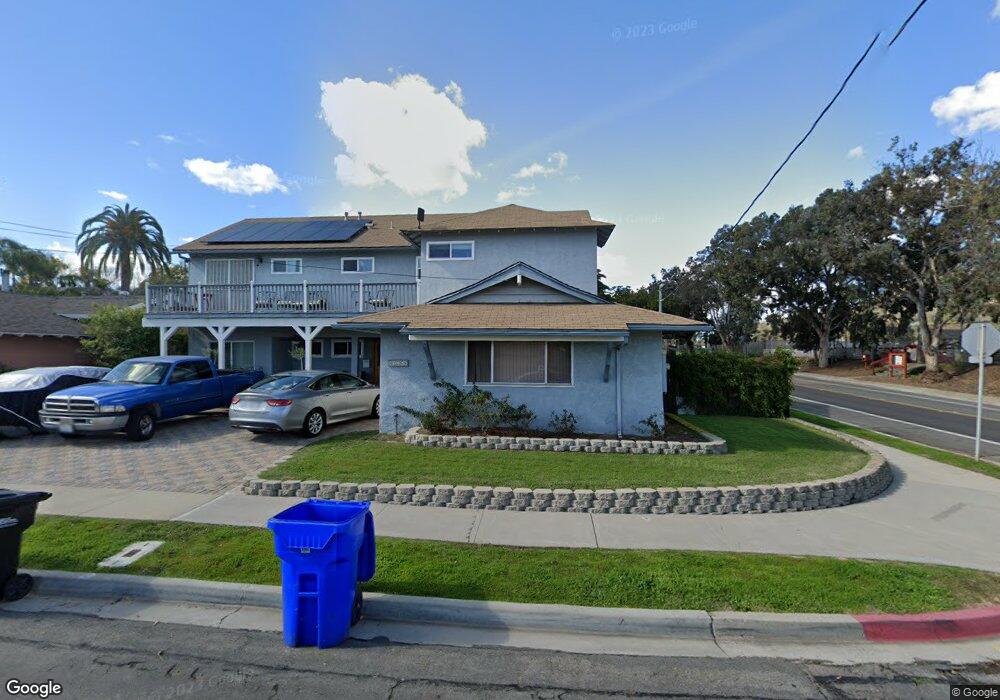
6398 Boulder Lake Ave San Diego, CA 92119
Lake Murray NeighborhoodEstimated Value: $1,187,000 - $1,376,000
7
Beds
4
Baths
3,097
Sq Ft
$417/Sq Ft
Est. Value
About This Home
This home is located at 6398 Boulder Lake Ave, San Diego, CA 92119 and is currently estimated at $1,291,345, approximately $416 per square foot. 6398 Boulder Lake Ave is a home located in San Diego County with nearby schools including Benchley-Weinberger Elementary, Pershing Middle School, and Patrick Henry High School.
Ownership History
Date
Name
Owned For
Owner Type
Purchase Details
Closed on
Sep 6, 2012
Sold by
Clark Raymond Paul and Clark Kimberly Ann
Bought by
Clark Raymond P and Clark Kimberly A
Current Estimated Value
Purchase Details
Closed on
Jun 10, 2003
Sold by
Clark Raymond Paul and Clark Kimberly Ann
Bought by
Clark Raymond Paul and Clark Kimberly Ann
Home Financials for this Owner
Home Financials are based on the most recent Mortgage that was taken out on this home.
Original Mortgage
$280,000
Interest Rate
4.87%
Mortgage Type
Purchase Money Mortgage
Purchase Details
Closed on
Oct 8, 1996
Sold by
Clark Raymond Paul
Bought by
Clark Raymond Paul and Clark Kimberly Ann
Home Financials for this Owner
Home Financials are based on the most recent Mortgage that was taken out on this home.
Original Mortgage
$110,000
Interest Rate
8.1%
Purchase Details
Closed on
Nov 10, 1995
Sold by
Clark Laura Lee
Bought by
Clark Raymond Paul
Create a Home Valuation Report for This Property
The Home Valuation Report is an in-depth analysis detailing your home's value as well as a comparison with similar homes in the area
Home Values in the Area
Average Home Value in this Area
Purchase History
| Date | Buyer | Sale Price | Title Company |
|---|---|---|---|
| Clark Raymond P | -- | None Available | |
| Clark Raymond Paul | -- | First American Title Co | |
| Clark Raymond Paul | -- | Chicago Title Company | |
| Clark Raymond Paul | -- | -- |
Source: Public Records
Mortgage History
| Date | Status | Borrower | Loan Amount |
|---|---|---|---|
| Closed | Clark Raymond Paul | $280,000 | |
| Closed | Clark Raymond Paul | $110,000 |
Source: Public Records
Tax History Compared to Growth
Tax History
| Year | Tax Paid | Tax Assessment Tax Assessment Total Assessment is a certain percentage of the fair market value that is determined by local assessors to be the total taxable value of land and additions on the property. | Land | Improvement |
|---|---|---|---|---|
| 2025 | $3,365 | $279,177 | $23,299 | $255,878 |
| 2024 | $3,365 | $273,704 | $22,843 | $250,861 |
| 2023 | $3,300 | $268,339 | $22,396 | $245,943 |
| 2022 | $3,211 | $263,078 | $21,957 | $241,121 |
| 2021 | $3,186 | $257,921 | $21,527 | $236,394 |
| 2020 | $3,148 | $255,278 | $21,307 | $233,971 |
| 2019 | $3,091 | $250,274 | $20,890 | $229,384 |
| 2018 | $2,888 | $245,368 | $20,481 | $224,887 |
| 2017 | $2,818 | $240,558 | $20,080 | $220,478 |
| 2016 | $2,771 | $235,842 | $19,687 | $216,155 |
| 2015 | $2,729 | $232,301 | $19,392 | $212,909 |
| 2014 | $2,677 | $227,752 | $19,013 | $208,739 |
Source: Public Records
Map
Nearby Homes
- 8364 Lake Ashwood Ave
- 6387 Anvil Lake Ave
- 6388 Anvil Lake Ave
- 8343 San Carlos Dr
- 6476 Jackson Dr
- 6252 Lake Albano Ave
- 6285 Anvil Lake Ave
- 7976 Lake Cayuga Dr
- 8374 Lake Gaby Ave
- 8649 Lake Murray Blvd Unit 4
- 8609 Lake Murray Blvd Unit 7
- 6354 Arms Lake Ave
- 6548 Bantam Lake Cir
- 8671 Lake Murray Blvd Unit 4
- 7838 Cowles Mountain Ct Unit C6
- 7838 Cowles Mountain Ct Unit C32
- 7838 Cowles Mountain Ct Unit 18
- 8419 Hudson Dr
- 7835 Cowles Mountain Ct Unit B6
- 8765 Lake Murray Blvd Unit 3
- 6392 Boulder Lake Ave
- 6386 Boulder Lake Ave
- 6393 Balsam Lake Ave
- 6387 Balsam Lake Ave
- 8303 Lake Adlon Dr
- 6380 Boulder Lake Ave
- 6381 Balsam Lake Ave
- 8304 Lake Artemus Ave
- 8302 Lake Adlon Dr
- 8311 Lake Adlon Dr
- 6374 Boulder Lake Ave
- 6375 Balsam Lake Ave
- 8310 Lake Adlon Dr
- 8314 Lake Artemus Ave
- 8319 Lake Adlon Dr
- 6394 Balsam Lake Ave
- 6386 Balsam Lake Ave
- 8301 June Lake Dr
- 8318 Lake Adlon Dr
- 6369 Balsam Lake Ave