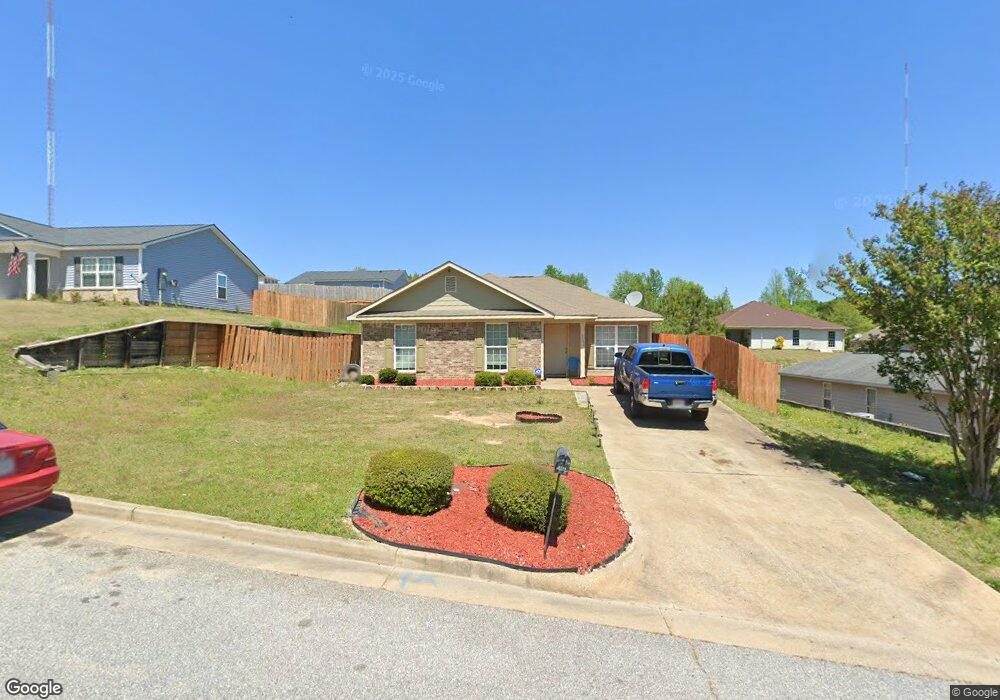
6399 Sandy Bottom Dr Columbus, GA 31907
East Columbus NeighborhoodEstimated Value: $172,000 - $221,000
4
Beds
3
Baths
1,542
Sq Ft
$129/Sq Ft
Est. Value
About This Home
This home is located at 6399 Sandy Bottom Dr, Columbus, GA 31907 and is currently estimated at $198,384, approximately $128 per square foot. 6399 Sandy Bottom Dr is a home located in Muscogee County with nearby schools including Georgetown Elementary School, East Columbus Magnet Academy, and Kendrick High School.
Ownership History
Date
Name
Owned For
Owner Type
Purchase Details
Closed on
Mar 15, 2018
Sold by
Windsong Bonacre Llc
Bought by
Shundrea Morrow
Current Estimated Value
Home Financials for this Owner
Home Financials are based on the most recent Mortgage that was taken out on this home.
Original Mortgage
$122,477
Outstanding Balance
$104,953
Interest Rate
4.38%
Mortgage Type
VA
Estimated Equity
$93,431
Purchase Details
Closed on
May 6, 2011
Sold by
Erickson David B
Bought by
Windsong Bonacre Llc
Create a Home Valuation Report for This Property
The Home Valuation Report is an in-depth analysis detailing your home's value as well as a comparison with similar homes in the area
Home Values in the Area
Average Home Value in this Area
Purchase History
| Date | Buyer | Sale Price | Title Company |
|---|---|---|---|
| Shundrea Morrow | $119,900 | -- | |
| Windsong Bonacre Llc | $2,520,000 | -- |
Source: Public Records
Mortgage History
| Date | Status | Borrower | Loan Amount |
|---|---|---|---|
| Open | Shundrea Morrow | $122,477 |
Source: Public Records
Tax History
| Year | Tax Paid | Tax Assessment Tax Assessment Total Assessment is a certain percentage of the fair market value that is determined by local assessors to be the total taxable value of land and additions on the property. | Land | Improvement |
|---|---|---|---|---|
| 2025 | $2,040 | $52,124 | $8,924 | $43,200 |
| 2024 | $2,040 | $52,124 | $8,924 | $43,200 |
| 2023 | $0 | $52,124 | $8,924 | $43,200 |
| 2022 | $0 | $46,700 | $8,924 | $37,776 |
| 2021 | $0 | $44,456 | $8,924 | $35,532 |
| 2020 | $0 | $44,456 | $8,924 | $35,532 |
| 2019 | $1,821 | $44,456 | $8,924 | $35,532 |
| 2018 | $1,821 | $44,456 | $8,924 | $35,532 |
| 2017 | $1,827 | $44,456 | $8,924 | $35,532 |
| 2016 | $2,078 | $50,385 | $12,000 | $38,385 |
| 2015 | $2,081 | $50,385 | $12,000 | $38,385 |
| 2014 | $2,083 | $50,385 | $12,000 | $38,385 |
| 2013 | -- | $50,385 | $12,000 | $38,385 |
Source: Public Records
Map
Nearby Homes
- 704 Crestline Dr
- 905 Bethune Ct
- 6257 Buena Vista Rd
- 665 Upland Ct
- 5708 Upland Way
- 728 Parkhill Dr
- 5825 Stafford Ln
- 736 Parkhill Dr
- 744 Parkhill Dr
- 908 Arlington Dr
- 132 Sweetwater Dr
- 1252 School House Dr
- 5501 Ambervista Ct
- 803 Vista Dr
- 156 Sweetwater Dr
- 719 Wilder Dr
- 1029 Amber Dr
- 5532 Buena Vista Rd
- 6125 Valencia Dr
- 6224 Valencia Dr
- 6401 Sandy Bottom Dr
- 6393 Sandy Bottom Dr
- 5706 Sandy View Dr
- 5712 Sandy View Dr
- 5700 Sandy View Dr
- 6407 Sandy Bottom Dr
- 6400 Sandy Bottom Dr
- 6394 Sandy Bottom Dr
- 5718 Sandy View Dr
- 6406 Sandy Bottom Dr
- 6413 Sandy Bottom Dr
- 6388 Sandy Bottom Dr
- 6387 Sandy Bottom Dr
- 6412 Sandy Bottom Dr
- 5724 Sandy View Dr
- 5724 Sandford Ave
- 6382 Sandy Bottom Dr
- 6419 Sandy Bottom Dr
- 5707 Sandy View Dr
- 689 Crestline Dr
Your Personal Tour Guide
Ask me questions while you tour the home.