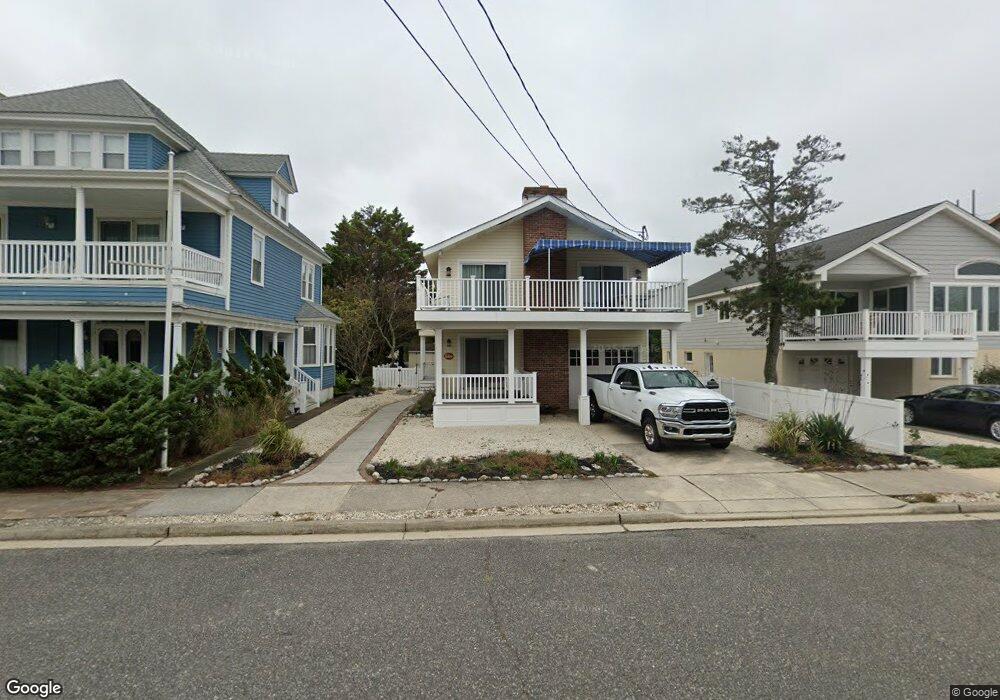
64 9th St W Avalon, NJ 08202
Estimated Value: $2,718,000 - $3,911,000
--
Bed
--
Bath
2,632
Sq Ft
$1,195/Sq Ft
Est. Value
About This Home
This home is located at 64 9th St W, Avalon, NJ 08202 and is currently estimated at $3,146,125, approximately $1,195 per square foot. 64 9th St W is a home located in Cape May County with nearby schools including Avalon Elementary School.
Ownership History
Date
Name
Owned For
Owner Type
Purchase Details
Closed on
Jan 25, 2007
Sold by
Kaslizmar Shore Llc
Bought by
Pahides Stephan and Mulla Wadia
Current Estimated Value
Home Financials for this Owner
Home Financials are based on the most recent Mortgage that was taken out on this home.
Original Mortgage
$417,000
Outstanding Balance
$251,289
Interest Rate
6.27%
Mortgage Type
Purchase Money Mortgage
Estimated Equity
$2,894,836
Purchase Details
Closed on
Jan 13, 2006
Sold by
Galperin Philip A
Bought by
Kaslizmar Shore Llc and Kaslizmar Beach Llc
Purchase Details
Closed on
Jan 15, 1997
Sold by
Dell'Oro Torr
Bought by
Galperin Phillip A
Purchase Details
Closed on
Aug 24, 1994
Sold by
Ianelli Louis J
Bought by
Dell'Oro Torr and Dell'Oro Gayle P
Home Financials for this Owner
Home Financials are based on the most recent Mortgage that was taken out on this home.
Original Mortgage
$272,000
Interest Rate
8.65%
Create a Home Valuation Report for This Property
The Home Valuation Report is an in-depth analysis detailing your home's value as well as a comparison with similar homes in the area
Home Values in the Area
Average Home Value in this Area
Purchase History
| Date | Buyer | Sale Price | Title Company |
|---|---|---|---|
| Pahides Stephan | -- | Commonwealth Land Title Insu | |
| Kaslizmar Shore Llc | $1,700,000 | Commonwealth Land Title Ins | |
| Galperin Phillip A | $325,000 | -- | |
| Dell'Oro Torr | $344,500 | -- |
Source: Public Records
Mortgage History
| Date | Status | Borrower | Loan Amount |
|---|---|---|---|
| Open | Pahides Stephan | $417,000 | |
| Previous Owner | Dell'Oro Torr | $272,000 |
Source: Public Records
Tax History Compared to Growth
Tax History
| Year | Tax Paid | Tax Assessment Tax Assessment Total Assessment is a certain percentage of the fair market value that is determined by local assessors to be the total taxable value of land and additions on the property. | Land | Improvement |
|---|---|---|---|---|
| 2025 | $9,087 | $1,479,900 | $1,200,000 | $279,900 |
| 2024 | $9,087 | $1,479,900 | $1,200,000 | $279,900 |
| 2023 | $9,013 | $1,479,900 | $1,200,000 | $279,900 |
| 2022 | $8,406 | $1,479,900 | $1,200,000 | $279,900 |
| 2021 | $8,095 | $1,479,900 | $1,200,000 | $279,900 |
| 2020 | $7,784 | $1,479,900 | $1,200,000 | $279,900 |
| 2019 | $7,547 | $1,479,900 | $1,200,000 | $279,900 |
| 2018 | $7,050 | $1,444,700 | $1,200,000 | $244,700 |
| 2017 | $6,134 | $1,103,300 | $900,000 | $203,300 |
| 2016 | $6,068 | $1,103,300 | $900,000 | $203,300 |
| 2015 | $5,969 | $1,103,300 | $900,000 | $203,300 |
| 2014 | $5,903 | $1,103,300 | $900,000 | $203,300 |
Source: Public Records
Map
Nearby Homes