
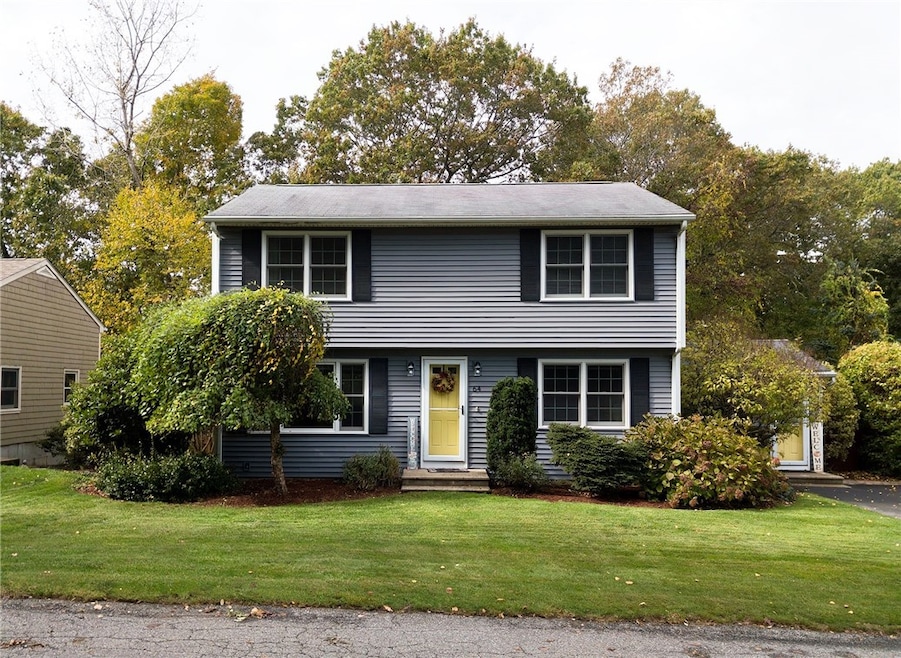
64 Aborn Ave Cumberland, RI 02864
Cumberland Hill NeighborhoodEstimated payment $3,151/month
Total Views
7,748
3
Beds
1.5
Baths
2,370
Sq Ft
$222
Price per Sq Ft
Highlights
- Above Ground Pool
- Colonial Architecture
- Attic
- John J. McLaughlin Cumberland Hill School Rated A-
- Wood Flooring
- Recreation Facilities
About This Home
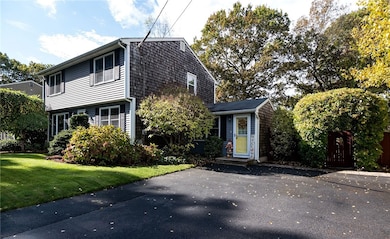
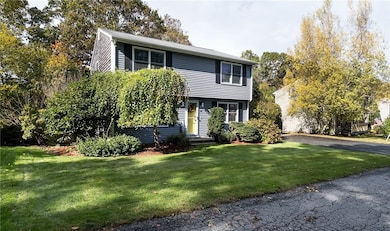
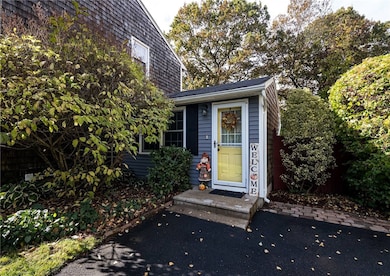
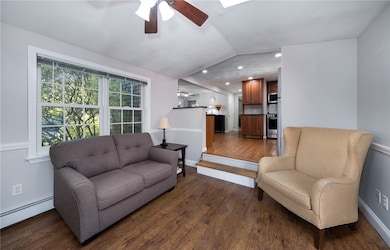
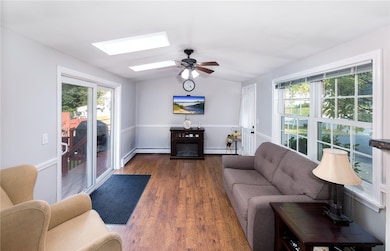
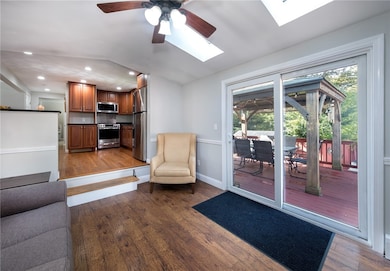
Beautiful Colonial in Cumberland Hill! Situated in a quiet, private neighborhood, this well-maintained Colonial offers an open floor plan with three bedrooms and one and a half newly remodeled bathrooms. The finished basement includes a walkout leading to a beautifully landscaped backyard featuring an above-ground pool and an oversized deck ideal for entertaining or relaxing outdoors. Recent updates include a brand-new water tank, boiler, and a washer and dryer set that will remain. The property showcases meticulous landscaping and a welcoming neighborhood atmosphere, conveniently located near schools, highway access, and local amenities. THIS IS AN ABSOLUTE MUST SEE! **HIGHEST AND BEST DUE 10/21 @6pm please.
Listing Agent
LaMontagne Real Estate License #RES.0034632 Listed on: 10/17/2025
Home Details
Home Type
- Single Family
Est. Annual Taxes
- $4,605
Year Built
- Built in 1986
Lot Details
- Fenced
- Property is zoned R1
Home Design
- Colonial Architecture
- Wood Siding
- Vinyl Siding
- Concrete Perimeter Foundation
- Plaster
Interior Spaces
- 2-Story Property
- Family Room
- Attic
Kitchen
- Oven
- Range
- Microwave
- Dishwasher
Flooring
- Wood
- Carpet
- Ceramic Tile
Bedrooms and Bathrooms
- 3 Bedrooms
- Bathtub with Shower
Laundry
- Dryer
- Washer
Partially Finished Basement
- Walk-Out Basement
- Basement Fills Entire Space Under The House
Parking
- 3 Parking Spaces
- No Garage
Pool
- Above Ground Pool
Utilities
- Cooling Available
- Heating System Uses Gas
- Hot Water Heating System
- Heating System Uses Steam
- Gas Water Heater
- Septic Tank
- Cable TV Available
Listing and Financial Details
- Tax Lot 133
- Assessor Parcel Number 64ABORNAVCUMB
Community Details
Overview
- Cumberland Hill Subdivision
Amenities
- Shops
- Restaurant
- Public Transportation
Recreation
- Recreation Facilities
Map
Create a Home Valuation Report for This Property
The Home Valuation Report is an in-depth analysis detailing your home's value as well as a comparison with similar homes in the area
Home Values in the Area
Average Home Value in this Area
Tax History
| Year | Tax Paid | Tax Assessment Tax Assessment Total Assessment is a certain percentage of the fair market value that is determined by local assessors to be the total taxable value of land and additions on the property. | Land | Improvement |
|---|---|---|---|---|
| 2025 | $4,761 | $388,000 | $133,000 | $255,000 |
| 2024 | $4,637 | $388,000 | $133,000 | $255,000 |
| 2023 | $4,509 | $388,000 | $133,000 | $255,000 |
| 2022 | $4,361 | $290,900 | $95,000 | $195,900 |
| 2021 | $4,288 | $290,900 | $95,000 | $195,900 |
| 2020 | $4,166 | $290,900 | $95,000 | $195,900 |
| 2019 | $4,054 | $255,300 | $80,000 | $175,300 |
| 2018 | $3,937 | $255,300 | $80,000 | $175,300 |
| 2017 | $3,883 | $255,300 | $80,000 | $175,300 |
| 2016 | $3,865 | $226,300 | $78,900 | $147,400 |
| 2015 | $3,865 | $226,300 | $78,900 | $147,400 |
| 2014 | $3,865 | $226,300 | $78,900 | $147,400 |
| 2013 | $3,543 | $224,500 | $83,300 | $141,200 |
Source: Public Records
Property History
| Date | Event | Price | List to Sale | Price per Sq Ft |
|---|---|---|---|---|
| 10/23/2025 10/23/25 | Pending | -- | -- | -- |
| 10/17/2025 10/17/25 | For Sale | $525,000 | -- | $222 / Sq Ft |
Source: State-Wide MLS
Purchase History
| Date | Type | Sale Price | Title Company |
|---|---|---|---|
| Warranty Deed | $138,000 | -- |
Source: Public Records
Mortgage History
| Date | Status | Loan Amount | Loan Type |
|---|---|---|---|
| Open | $12,000 | Unknown | |
| Open | $176,000 | No Value Available | |
| Closed | $224,867 | No Value Available |
Source: Public Records
About the Listing Agent
I’ve been part of LaMontagne Real Estate for over 15 years, following in the footsteps of my mother, Carol LaMontagne, who was a top-producing agent in Northern Rhode Island for more than 40 years. Her passion for real estate inspired mine, and I’m proud to continue that legacy.
I specialize in luxury homes and first-time homebuyers, with a strong focus on personalized service, clear communication, and expert market knowledge. In 2023, I was named a Top Five Producer with over $14 million in
Keri's Other Listings
Source: State-Wide MLS
MLS Number: 1397669
APN: CUMB-000052-000133-000000
Disclaimer: Certain information contained herein is derived from information provided by parties other than Homes.com. All information provided is deemed reliable, but is not guaranteed to be accurate and should be independently verified.
![]() IDX information is provided exclusively for personal, non-commercial use, and may not be used for any purpose other than to identify prospective properties consumers may be interested in purchasing. Information is deemed reliable but not guaranteed.
IDX information is provided exclusively for personal, non-commercial use, and may not be used for any purpose other than to identify prospective properties consumers may be interested in purchasing. Information is deemed reliable but not guaranteed.
Copyright © 2025 State-Wide MLS, Inc. All rights reserved.
Nearby Homes