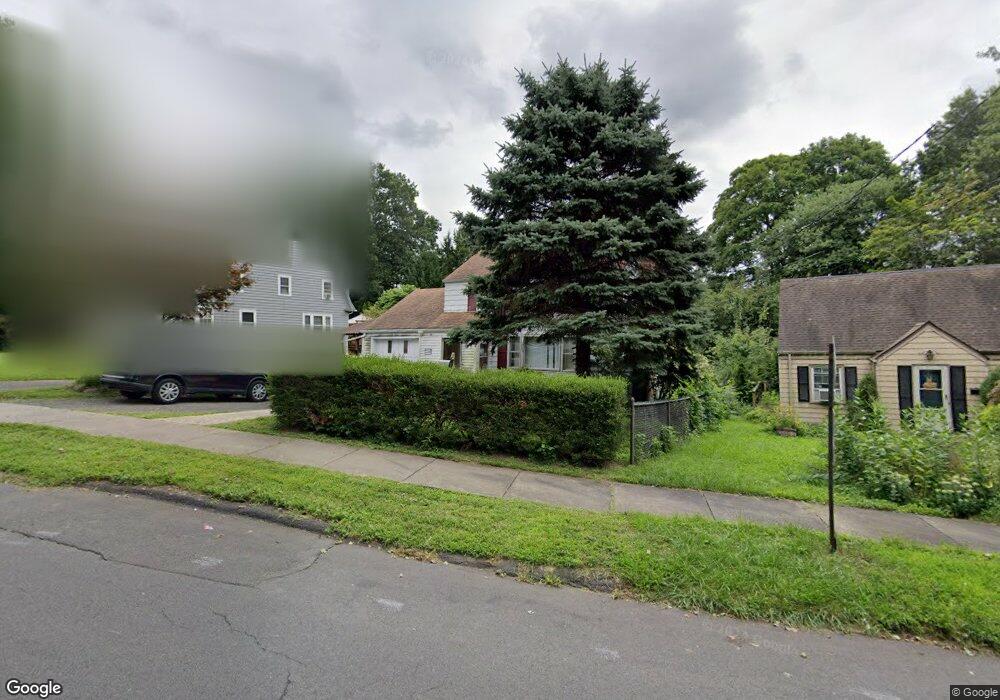
64 Andrews St New Britain, CT 06051
Estimated Value: $231,000 - $276,000
2
Beds
1
Bath
1,320
Sq Ft
$190/Sq Ft
Est. Value
About This Home
This home is located at 64 Andrews St, New Britain, CT 06051 and is currently estimated at $251,365, approximately $190 per square foot. 64 Andrews St is a home located in Hartford County with nearby schools including Vance School, Slade Middle School, and Raymond Hill School.
Ownership History
Date
Name
Owned For
Owner Type
Purchase Details
Closed on
Dec 1, 2022
Sold by
Doiron Brian and Doiron Katherine
Bought by
Montalvo Edgar
Current Estimated Value
Purchase Details
Closed on
Dec 28, 2001
Sold by
Chfa
Bought by
Doiron Brian and Anderson Kathleen
Purchase Details
Closed on
Jun 3, 1996
Sold by
Pinkerton Laura
Bought by
Yezierski Martin
Create a Home Valuation Report for This Property
The Home Valuation Report is an in-depth analysis detailing your home's value as well as a comparison with similar homes in the area
Home Values in the Area
Average Home Value in this Area
Purchase History
| Date | Buyer | Sale Price | Title Company |
|---|---|---|---|
| Montalvo Edgar | $90,000 | None Available | |
| Doiron Brian | $79,900 | -- | |
| Yezierski Martin | $63,000 | -- |
Source: Public Records
Mortgage History
| Date | Status | Borrower | Loan Amount |
|---|---|---|---|
| Previous Owner | Yezierski Martin | $18,839 | |
| Previous Owner | Yezierski Martin | $17,000 | |
| Previous Owner | Yezierski Martin | $15,000 |
Source: Public Records
Tax History Compared to Growth
Tax History
| Year | Tax Paid | Tax Assessment Tax Assessment Total Assessment is a certain percentage of the fair market value that is determined by local assessors to be the total taxable value of land and additions on the property. | Land | Improvement |
|---|---|---|---|---|
| 2025 | $4,306 | $109,900 | $44,870 | $65,030 |
| 2024 | $4,351 | $109,900 | $44,870 | $65,030 |
| 2023 | $4,207 | $109,900 | $44,870 | $65,030 |
| 2022 | $3,669 | $74,130 | $20,650 | $53,480 |
| 2021 | $3,669 | $74,130 | $20,650 | $53,480 |
| 2020 | $3,744 | $74,130 | $20,650 | $53,480 |
| 2019 | $3,744 | $74,130 | $20,650 | $53,480 |
| 2018 | $3,744 | $74,130 | $20,650 | $53,480 |
| 2017 | $3,606 | $71,400 | $18,970 | $52,430 |
| 2016 | $3,606 | $71,400 | $18,970 | $52,430 |
| 2015 | $3,499 | $71,400 | $18,970 | $52,430 |
| 2014 | $3,499 | $71,400 | $18,970 | $52,430 |
Source: Public Records
Map
Nearby Homes