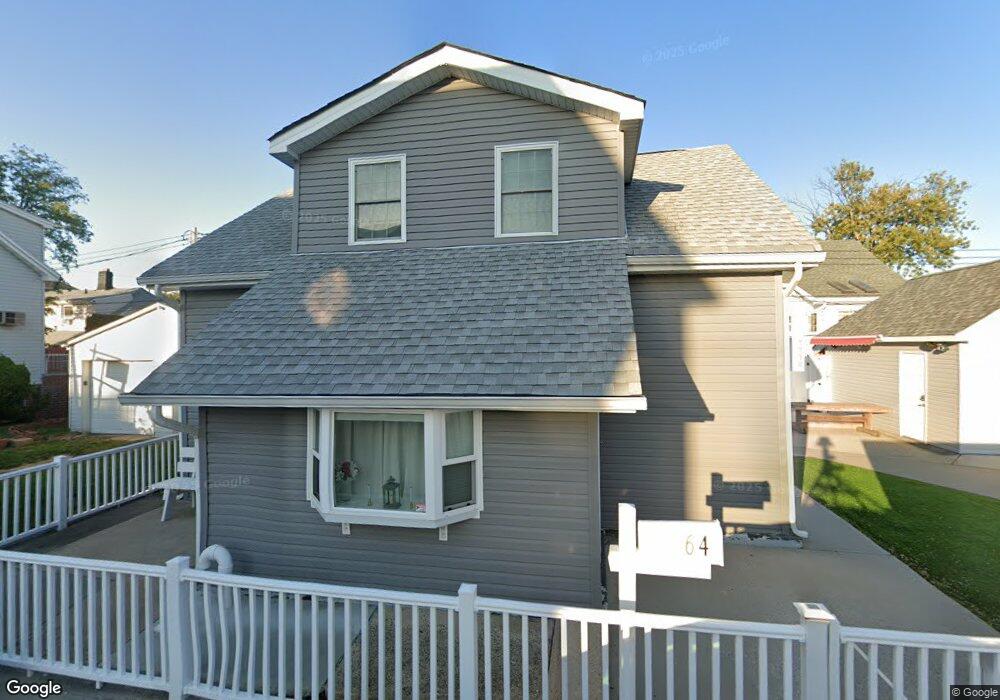
64 Bevy Ct Brooklyn, NY 11229
Gerritsen Beach NeighborhoodEstimated Value: $670,000 - $796,000
Studio
--
Bath
1,099
Sq Ft
$692/Sq Ft
Est. Value
About This Home
This home is located at 64 Bevy Ct, Brooklyn, NY 11229 and is currently estimated at $760,960, approximately $692 per square foot. 64 Bevy Ct is a home located in Kings County with nearby schools including P.S. 277 Gerritsen Beach, J.H.S. 278 Marine Park, and New Visions Charter High School for Advanced Math/ Science.
Ownership History
Date
Name
Owned For
Owner Type
Purchase Details
Closed on
Jul 15, 2024
Sold by
Hayes Arcilia and Hayes Michael
Bought by
Verba Kaitlin and Verba Vladyslav
Current Estimated Value
Home Financials for this Owner
Home Financials are based on the most recent Mortgage that was taken out on this home.
Original Mortgage
$663,000
Outstanding Balance
$650,782
Interest Rate
6.95%
Mortgage Type
Purchase Money Mortgage
Estimated Equity
$110,178
Purchase Details
Closed on
Apr 15, 2016
Sold by
Hayes Barbara and Hayes James
Bought by
Hayes Arcilia and Hayes Michael
Purchase Details
Closed on
Jul 16, 2014
Sold by
Houdlett Elaina
Bought by
Hayes Barbara and Hayes James
Purchase Details
Closed on
Sep 27, 2005
Sold by
Maniaci Teresita
Bought by
Maniaci Peter P
Create a Home Valuation Report for This Property
The Home Valuation Report is an in-depth analysis detailing your home's value as well as a comparison with similar homes in the area
Home Values in the Area
Average Home Value in this Area
Purchase History
We collect this data history from publicly available records. To have your information removed, we recommend requesting removal directly through your county’s website.
| Date | Buyer | Sale Price | Title Company |
|---|---|---|---|
| Verba Kaitlin | $780,000 | -- | |
| Verba Kaitlin | $780,000 | -- | |
| Hayes Arcilia | -- | -- | |
| Hayes Arcilia | -- | -- | |
| Hayes Arcilia | -- | -- | |
| Hayes Barbara | $225,000 | -- | |
| Hayes Barbara | $225,000 | -- | |
| Maniaci Peter P | -- | -- | |
| Maniaci Peter P | -- | -- |
Source: Public Records
Mortgage History
We collect this data history from publicly available records. To have your information removed, we recommend requesting removal directly through your county’s website.
| Date | Status | Borrower | Loan Amount |
|---|---|---|---|
| Open | Verba Kaitlin | $663,000 | |
| Closed | Verba Kaitlin | $663,000 |
Source: Public Records
Tax History
| Year | Tax Paid | Tax Assessment Tax Assessment Total Assessment is a certain percentage of the fair market value that is determined by local assessors to be the total taxable value of land and additions on the property. | Land | Improvement |
|---|---|---|---|---|
| 2026 | $5,862 | $41,760 | $16,200 | $25,560 |
| 2025 | $5,249 | $31,800 | $16,200 | $15,600 |
| 2024 | $5,249 | $33,180 | $16,200 | $16,980 |
| 2023 | $4,991 | $37,680 | $16,200 | $21,480 |
| 2022 | $4,605 | $39,360 | $16,200 | $23,160 |
| 2021 | $4,861 | $38,280 | $16,200 | $22,080 |
| 2020 | $2,396 | $34,800 | $16,200 | $18,600 |
| 2019 | $4,507 | $37,920 | $16,200 | $21,720 |
| 2018 | $4,115 | $21,645 | $12,872 | $8,773 |
| 2017 | $3,863 | $20,420 | $15,358 | $5,062 |
| 2016 | $3,772 | $20,420 | $13,924 | $6,496 |
| 2015 | $2,197 | $19,905 | $14,890 | $5,015 |
| 2014 | $2,197 | $18,810 | $14,071 | $4,739 |
Source: Public Records
Map
Nearby Homes
Your Personal Tour Guide
Ask me questions while you tour the home.