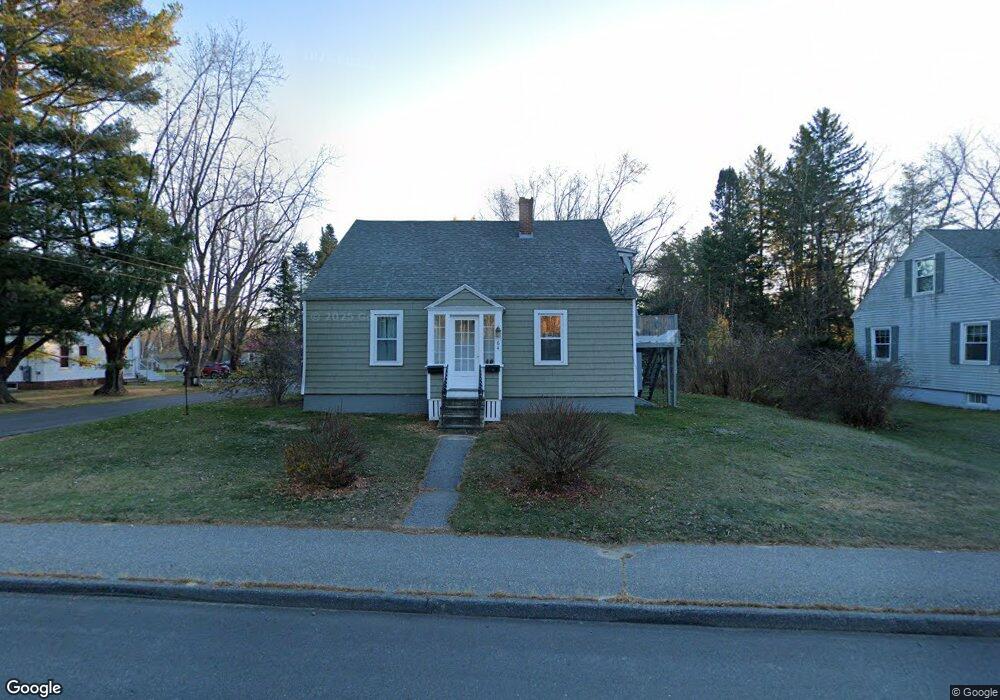
64 Bridge St Topsham, ME 04086
Estimated Value: $447,000 - $515,932
4
Beds
2
Baths
2,016
Sq Ft
$240/Sq Ft
Est. Value
About This Home
This home is located at 64 Bridge St, Topsham, ME 04086 and is currently estimated at $482,983, approximately $239 per square foot. 64 Bridge St is a home located in Sagadahoc County with nearby schools including Mt Ararat High School, Harpswell Coastal Academy Divisions 2 and 3, and St. John's Catholic School.
Ownership History
Date
Name
Owned For
Owner Type
Purchase Details
Closed on
Jun 10, 2022
Sold by
Soule Dolores I
Bought by
Dolliver Tricia and Lessard Peter J
Current Estimated Value
Home Financials for this Owner
Home Financials are based on the most recent Mortgage that was taken out on this home.
Original Mortgage
$289,656
Outstanding Balance
$274,794
Interest Rate
5.1%
Mortgage Type
FHA
Estimated Equity
$208,189
Create a Home Valuation Report for This Property
The Home Valuation Report is an in-depth analysis detailing your home's value as well as a comparison with similar homes in the area
Home Values in the Area
Average Home Value in this Area
Purchase History
| Date | Buyer | Sale Price | Title Company |
|---|---|---|---|
| Dolliver Tricia | -- | None Available |
Source: Public Records
Mortgage History
| Date | Status | Borrower | Loan Amount |
|---|---|---|---|
| Open | Dolliver Tricia | $289,656 |
Source: Public Records
Tax History Compared to Growth
Tax History
| Year | Tax Paid | Tax Assessment Tax Assessment Total Assessment is a certain percentage of the fair market value that is determined by local assessors to be the total taxable value of land and additions on the property. | Land | Improvement |
|---|---|---|---|---|
| 2025 | $4,978 | $388,900 | $73,100 | $315,800 |
| 2024 | $4,866 | $389,300 | $67,700 | $321,600 |
| 2023 | $4,677 | $344,400 | $64,500 | $279,900 |
| 2022 | $3,948 | $273,800 | $59,900 | $213,900 |
| 2021 | $3,829 | $241,300 | $55,000 | $186,300 |
| 2020 | $3,892 | $217,900 | $55,000 | $162,900 |
| 2019 | $3,734 | $195,000 | $52,800 | $142,200 |
| 2018 | $3,486 | $186,100 | $41,200 | $144,900 |
| 2017 | $3,372 | $186,100 | $41,200 | $144,900 |
| 2016 | $3,294 | $183,100 | $41,200 | $141,900 |
| 2015 | $3,183 | $177,200 | $41,200 | $136,000 |
| 2014 | $2,969 | $171,300 | $41,200 | $130,100 |
| 2013 | $2,852 | $171,300 | $41,200 | $130,100 |
Source: Public Records
Map
Nearby Homes
- 29 Winter St
- 57 Winter St
- 0 Mill St
- 4 Wilson St
- 19 Mason St
- 43 Forest Glen Ln
- 1 High St
- 11 Lincoln St
- 118 Main St
- 5 Summer St
- 19 Mast Ln Unit 19
- 49 Signature Dr
- 35 Signature Dr Unit 28
- 4 Homestead Dr
- 55 Munroe Ln
- 20 Sadler Dr
- Lot 196 Mckeen St Unit 16
- Lot 196 Mckeen St Unit 17
- Lot 196 Mckeen St Unit 21
- 35 Bath Rd