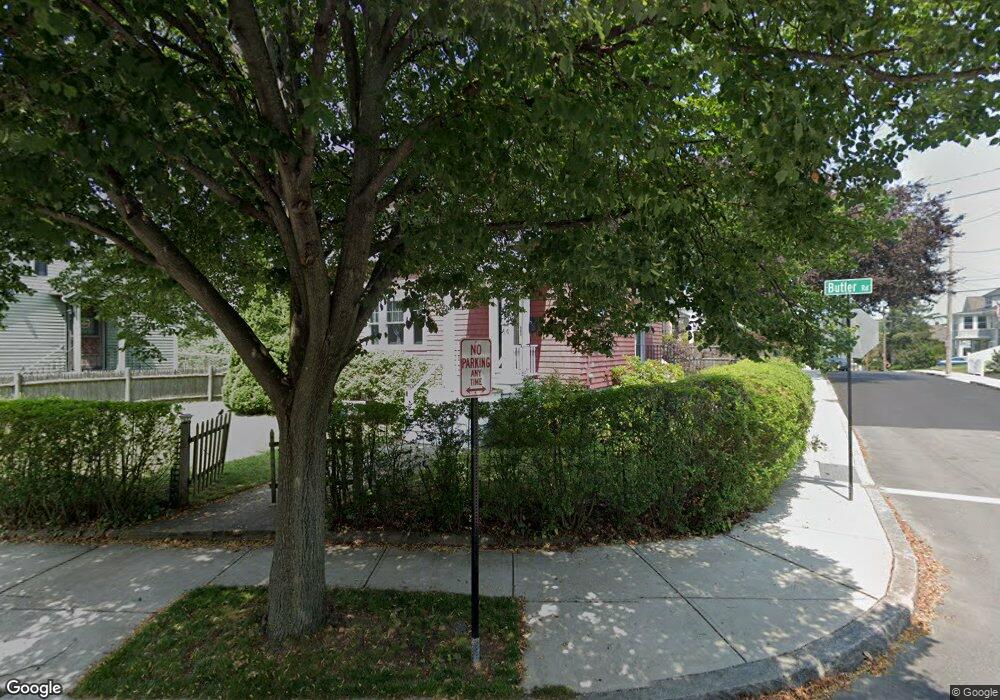
64 Butler Rd Quincy, MA 02169
Quincy Center NeighborhoodEstimated Value: $644,746 - $716,000
3
Beds
2
Baths
1,269
Sq Ft
$542/Sq Ft
Est. Value
About This Home
This home is located at 64 Butler Rd, Quincy, MA 02169 and is currently estimated at $687,187, approximately $541 per square foot. 64 Butler Rd is a home located in Norfolk County with nearby schools including Merrymount Elementary School, Central Middle School, and Quincy High School.
Ownership History
Date
Name
Owned For
Owner Type
Purchase Details
Closed on
Dec 9, 2014
Sold by
Querns Dawn M
Bought by
Dawn M Querns Ret
Current Estimated Value
Purchase Details
Closed on
Nov 28, 2005
Sold by
Lane Gregory J and Lane Sara F
Bought by
Querns Dawn M and Coffey Thomas R
Home Financials for this Owner
Home Financials are based on the most recent Mortgage that was taken out on this home.
Original Mortgage
$288,600
Interest Rate
6.06%
Mortgage Type
Purchase Money Mortgage
Purchase Details
Closed on
Jun 25, 2001
Sold by
Ohara Anne C
Bought by
Lane Gregory J and Lane Sara F
Home Financials for this Owner
Home Financials are based on the most recent Mortgage that was taken out on this home.
Original Mortgage
$243,000
Interest Rate
7.09%
Mortgage Type
Purchase Money Mortgage
Purchase Details
Closed on
Nov 2, 1992
Sold by
Sullivan Rt
Bought by
Ohara Anne C
Create a Home Valuation Report for This Property
The Home Valuation Report is an in-depth analysis detailing your home's value as well as a comparison with similar homes in the area
Home Values in the Area
Average Home Value in this Area
Purchase History
| Date | Buyer | Sale Price | Title Company |
|---|---|---|---|
| Dawn M Querns Ret | -- | -- | |
| Querns Dawn M | $360,750 | -- | |
| Lane Gregory J | $260,000 | -- | |
| Ohara Anne C | $132,500 | -- |
Source: Public Records
Mortgage History
| Date | Status | Borrower | Loan Amount |
|---|---|---|---|
| Previous Owner | Ohara Anne C | $267,340 | |
| Previous Owner | Querns Dawn M | $288,600 | |
| Previous Owner | Ohara Anne C | $242,000 | |
| Previous Owner | Ohara Anne C | $243,000 |
Source: Public Records
Tax History Compared to Growth
Tax History
| Year | Tax Paid | Tax Assessment Tax Assessment Total Assessment is a certain percentage of the fair market value that is determined by local assessors to be the total taxable value of land and additions on the property. | Land | Improvement |
|---|---|---|---|---|
| 2025 | $6,066 | $526,100 | $272,300 | $253,800 |
| 2024 | $5,758 | $510,900 | $259,300 | $251,600 |
| 2023 | $5,241 | $470,900 | $235,800 | $235,100 |
| 2022 | $5,235 | $437,000 | $214,400 | $222,600 |
| 2021 | $5,206 | $428,800 | $214,400 | $214,400 |
| 2020 | $5,069 | $407,800 | $204,100 | $203,700 |
| 2019 | $4,670 | $372,100 | $192,600 | $179,500 |
| 2018 | $4,872 | $365,200 | $192,600 | $172,600 |
| 2017 | $4,675 | $329,900 | $183,400 | $146,500 |
| 2016 | $4,482 | $312,100 | $174,700 | $137,400 |
| 2015 | $4,395 | $301,000 | $174,700 | $126,300 |
| 2014 | $4,075 | $274,200 | $166,300 | $107,900 |
Source: Public Records
Map
Nearby Homes
- 74 Butler Rd
- 20 Putnam St
- 1025 Hancock St Unit 2K
- 77 Adams St Unit 610
- 1 Adams St Unit 707
- 10 Presidents Ln Unit 10
- 20 Whitney Rd Unit 1
- 45 Oval Rd Unit 6
- 200 Adams St
- 165 Old Colony Ave Unit A
- 72 Oakland Ave
- 1427 Quincy Shore Dr
- 1421 Quincy Shore Dr
- 22 Newton Ave
- 163 Clay St Unit C
- 105 Sea St Unit 301
- 105 Sea St Unit 203
- 105 Sea St Unit 105
- 465 Newport Ave
- 59 Spear St Unit 302
- 60 Butler Rd
- 57 Putnam St
- 57 Putnam St Unit 2
- 74 Butler Rd Unit 74
- 74 Butler Rd Unit 1
- 60 Hudson St
- 56 Butler Rd
- 76 Butler Rd Unit 1
- 76 Butler Rd Unit 76
- 76 Butler Rd
- 72 Putnam St
- 54 Putnam St Unit 1
- 54 Putnam St
- 52 Putnam St
- 52 Putnam St Unit 1
- 79 Butler Rd
- 49 Putnam St
- 52 Hudson St
- 81 Putnam St
- 78 Putnam St