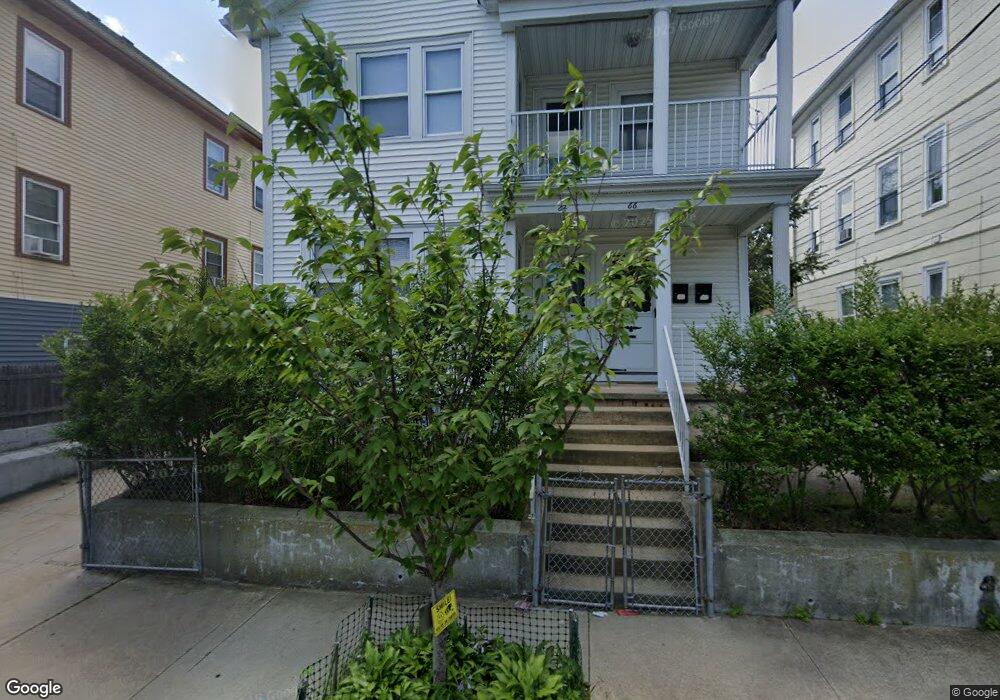
64 Clarence St Providence, RI 02909
Silver Lake NeighborhoodEstimated Value: $490,975 - $668,000
4
Beds
2
Baths
2,804
Sq Ft
$220/Sq Ft
Est. Value
About This Home
This home is located at 64 Clarence St, Providence, RI 02909 and is currently estimated at $616,244, approximately $219 per square foot. 64 Clarence St is a home located in Providence County with nearby schools including Asa Messer Elementary School, Charles N. Fortes Elementary School, and Laurel Hill Annex School.
Ownership History
Date
Name
Owned For
Owner Type
Purchase Details
Closed on
Jun 3, 2022
Sold by
Baez Felix
Bought by
Chalas Melanie J
Current Estimated Value
Home Financials for this Owner
Home Financials are based on the most recent Mortgage that was taken out on this home.
Original Mortgage
$445,005
Outstanding Balance
$421,590
Interest Rate
5.11%
Mortgage Type
Purchase Money Mortgage
Estimated Equity
$194,654
Purchase Details
Closed on
Dec 22, 2008
Sold by
Wells Fargo Bank Na
Bought by
Baez Felix
Purchase Details
Closed on
Apr 11, 2008
Sold by
Gomez Nicasio
Bought by
Wells Fargo Bank Na
Purchase Details
Closed on
Apr 13, 2005
Sold by
Ventura Lissette and Sanchez Edy
Bought by
Gomez Nicasio
Home Financials for this Owner
Home Financials are based on the most recent Mortgage that was taken out on this home.
Original Mortgage
$242,250
Interest Rate
5.78%
Mortgage Type
Purchase Money Mortgage
Create a Home Valuation Report for This Property
The Home Valuation Report is an in-depth analysis detailing your home's value as well as a comparison with similar homes in the area
Home Values in the Area
Average Home Value in this Area
Purchase History
| Date | Buyer | Sale Price | Title Company |
|---|---|---|---|
| Chalas Melanie J | $435,000 | None Available | |
| Baez Felix | $97,000 | -- | |
| Wells Fargo Bank Na | $213,249 | -- | |
| Gomez Nicasio | $285,000 | -- |
Source: Public Records
Mortgage History
| Date | Status | Borrower | Loan Amount |
|---|---|---|---|
| Open | Chalas Melanie J | $445,005 | |
| Previous Owner | Gomez Nicasio | $242,250 |
Source: Public Records
Tax History Compared to Growth
Tax History
| Year | Tax Paid | Tax Assessment Tax Assessment Total Assessment is a certain percentage of the fair market value that is determined by local assessors to be the total taxable value of land and additions on the property. | Land | Improvement |
|---|---|---|---|---|
| 2025 | $3,672 | $486,300 | $128,800 | $357,500 |
| 2024 | $5,911 | $322,100 | $72,500 | $249,600 |
| 2023 | $5,911 | $322,100 | $72,500 | $249,600 |
| 2022 | $5,733 | $322,100 | $72,500 | $249,600 |
| 2021 | $4,946 | $201,400 | $47,000 | $154,400 |
| 2020 | $4,946 | $201,400 | $47,000 | $154,400 |
| 2019 | $4,946 | $201,400 | $47,000 | $154,400 |
| 2018 | $4,618 | $144,500 | $45,600 | $98,900 |
| 2017 | $4,618 | $144,500 | $45,600 | $98,900 |
| 2016 | $4,618 | $144,500 | $45,600 | $98,900 |
| 2015 | $4,326 | $130,700 | $48,500 | $82,200 |
| 2014 | $4,411 | $130,700 | $48,500 | $82,200 |
| 2013 | $4,411 | $130,700 | $48,500 | $82,200 |
Source: Public Records
Map
Nearby Homes
- 62 Clarence St
- 68 Clarence St
- 72 Clarence St
- 89 Whitehall St
- 59 Wallace St
- 65 Wallace St
- 78 Clarence St
- 71 Clarence St Unit 73
- 80 Whitehall St
- 59 Clarence St
- 69 Clarence St
- 76 Whitehall St
- 67 Wallace St
- 67 Wallace St Unit 1
- 70 Whitehall St
- 80 Clarence St
- 80 Clarence St Unit 2
- 69 Wallace St Unit 3
- 66 Whitehall St
- 75 Clarence St