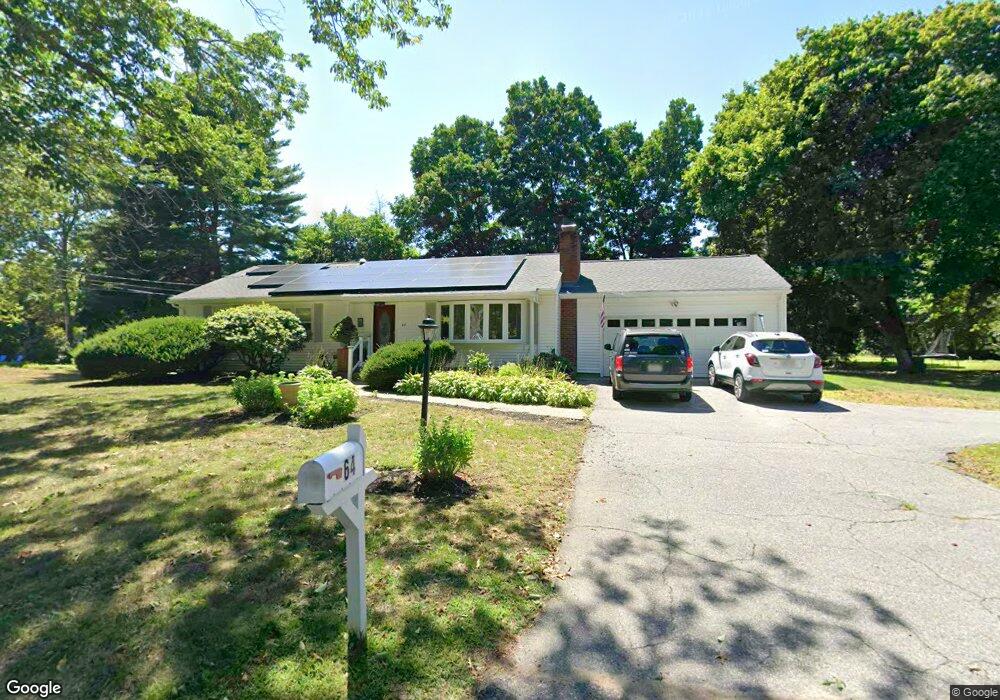
64 Clifton St Attleboro, MA 02703
Estimated Value: $456,000 - $659,000
3
Beds
2
Baths
2,176
Sq Ft
$272/Sq Ft
Est. Value
About This Home
This home is located at 64 Clifton St, Attleboro, MA 02703 and is currently estimated at $591,034, approximately $271 per square foot. 64 Clifton St is a home located in Bristol County with nearby schools including A. Irvin Studley Elementary School, Cyril K. Brennan Middle School, and Attleboro High School.
Ownership History
Date
Name
Owned For
Owner Type
Purchase Details
Closed on
Feb 26, 2001
Sold by
Doiron Alice O
Bought by
Sanseverin Frank J and Tricarico Maria A
Current Estimated Value
Purchase Details
Closed on
Aug 1, 1997
Sold by
Beauvais David S and Beauvais Debra
Bought by
Doiron Alice O
Purchase Details
Closed on
Apr 9, 1993
Sold by
Dm and Kelman T
Bought by
Beauvais David S and Beauvais Debra L
Create a Home Valuation Report for This Property
The Home Valuation Report is an in-depth analysis detailing your home's value as well as a comparison with similar homes in the area
Home Values in the Area
Average Home Value in this Area
Purchase History
| Date | Buyer | Sale Price | Title Company |
|---|---|---|---|
| Sanseverin Frank J | $190,000 | -- | |
| Doiron Alice O | $130,000 | -- | |
| Beauvais David S | $115,350 | -- |
Source: Public Records
Mortgage History
| Date | Status | Borrower | Loan Amount |
|---|---|---|---|
| Open | Beauvais David S | $146,000 | |
| Closed | Beauvais David S | $180,000 | |
| Closed | Beauvais David S | $100,000 |
Source: Public Records
Tax History
| Year | Tax Paid | Tax Assessment Tax Assessment Total Assessment is a certain percentage of the fair market value that is determined by local assessors to be the total taxable value of land and additions on the property. | Land | Improvement |
|---|---|---|---|---|
| 2025 | $6,667 | $531,200 | $141,200 | $390,000 |
| 2024 | $6,183 | $485,700 | $141,200 | $344,500 |
| 2023 | $5,501 | $401,800 | $128,400 | $273,400 |
| 2022 | $5,242 | $362,800 | $122,300 | $240,500 |
| 2021 | $4,798 | $324,200 | $117,700 | $206,500 |
| 2020 | $4,669 | $320,700 | $114,400 | $206,300 |
| 2019 | $4,459 | $314,900 | $112,300 | $202,600 |
| 2018 | $15,500 | $292,200 | $108,900 | $183,300 |
| 2017 | $3,987 | $274,000 | $108,900 | $165,100 |
| 2016 | $3,752 | $253,200 | $106,800 | $146,400 |
| 2015 | $3,754 | $255,200 | $106,800 | $148,400 |
| 2014 | $3,476 | $234,100 | $101,700 | $132,400 |
Source: Public Records
Map
Nearby Homes
- 160 West St
- 46 Berwick Rd
- 15 North Ave
- 26 West St
- 75 Dennis St Unit 3
- 64 Mechanic St Unit 3
- 64 Mechanic St
- 10 John St
- 49 Dennis St
- 18-20 Jefferson St
- 21 4th St
- 720 Thacher St
- 147 County St
- 660 Thacher St Unit 402
- 101 South Ave Unit 301
- 101 South Ave Unit 1004
- 17 Jewel Ave
- 0 Rosedale Ln Unit 73469293
- 17 Crawford Ave
- 32 Park St Unit 4
Your Personal Tour Guide
Ask me questions while you tour the home.