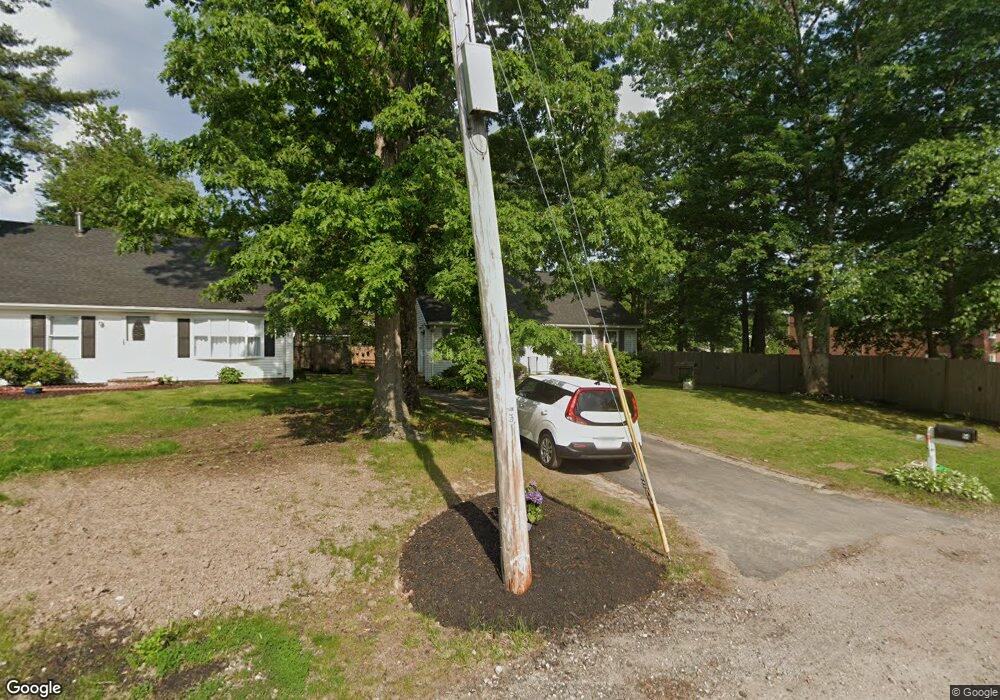
64 Dunbar St Brockton, MA 02302
Campello NeighborhoodEstimated Value: $467,000 - $508,000
3
Beds
1
Bath
1,411
Sq Ft
$351/Sq Ft
Est. Value
About This Home
This home is located at 64 Dunbar St, Brockton, MA 02302 and is currently estimated at $495,957, approximately $351 per square foot. 64 Dunbar St is a home located in Plymouth County with nearby schools including Davis K-8 School, John F. Kennedy Elementary School, and South Middle School.
Ownership History
Date
Name
Owned For
Owner Type
Purchase Details
Closed on
Oct 2, 1996
Sold by
Mahoney Brian E and Mahoney Lori A
Bought by
Rubilar Gloria
Current Estimated Value
Home Financials for this Owner
Home Financials are based on the most recent Mortgage that was taken out on this home.
Original Mortgage
$90,250
Outstanding Balance
$8,147
Interest Rate
7.9%
Mortgage Type
Purchase Money Mortgage
Estimated Equity
$487,810
Purchase Details
Closed on
Jan 9, 1991
Sold by
Eldan Constr Co Inc
Bought by
Mahoney Brian E and Mahoney Lori A
Home Financials for this Owner
Home Financials are based on the most recent Mortgage that was taken out on this home.
Original Mortgage
$109,000
Interest Rate
9.83%
Mortgage Type
Purchase Money Mortgage
Create a Home Valuation Report for This Property
The Home Valuation Report is an in-depth analysis detailing your home's value as well as a comparison with similar homes in the area
Home Values in the Area
Average Home Value in this Area
Purchase History
| Date | Buyer | Sale Price | Title Company |
|---|---|---|---|
| Rubilar Gloria | $95,000 | -- | |
| Mahoney Brian E | $109,000 | -- |
Source: Public Records
Mortgage History
| Date | Status | Borrower | Loan Amount |
|---|---|---|---|
| Open | Mahoney Brian E | $90,250 | |
| Previous Owner | Mahoney Brian E | $109,000 |
Source: Public Records
Tax History Compared to Growth
Tax History
| Year | Tax Paid | Tax Assessment Tax Assessment Total Assessment is a certain percentage of the fair market value that is determined by local assessors to be the total taxable value of land and additions on the property. | Land | Improvement |
|---|---|---|---|---|
| 2025 | $5,124 | $423,100 | $156,900 | $266,200 |
| 2024 | $4,824 | $401,300 | $156,900 | $244,400 |
| 2023 | $4,720 | $363,600 | $107,100 | $256,500 |
| 2022 | $4,709 | $337,100 | $97,300 | $239,800 |
| 2021 | $4,150 | $286,200 | $89,300 | $196,900 |
| 2020 | $4,133 | $272,800 | $78,800 | $194,000 |
| 2019 | $4,090 | $263,200 | $74,800 | $188,400 |
| 2018 | $3,626 | $225,800 | $74,800 | $151,000 |
| 2017 | $3,466 | $215,300 | $74,800 | $140,500 |
| 2016 | $3,293 | $189,700 | $71,300 | $118,400 |
| 2015 | $2,969 | $163,600 | $71,300 | $92,300 |
| 2014 | $3,022 | $166,700 | $71,300 | $95,400 |
Source: Public Records
Map
Nearby Homes