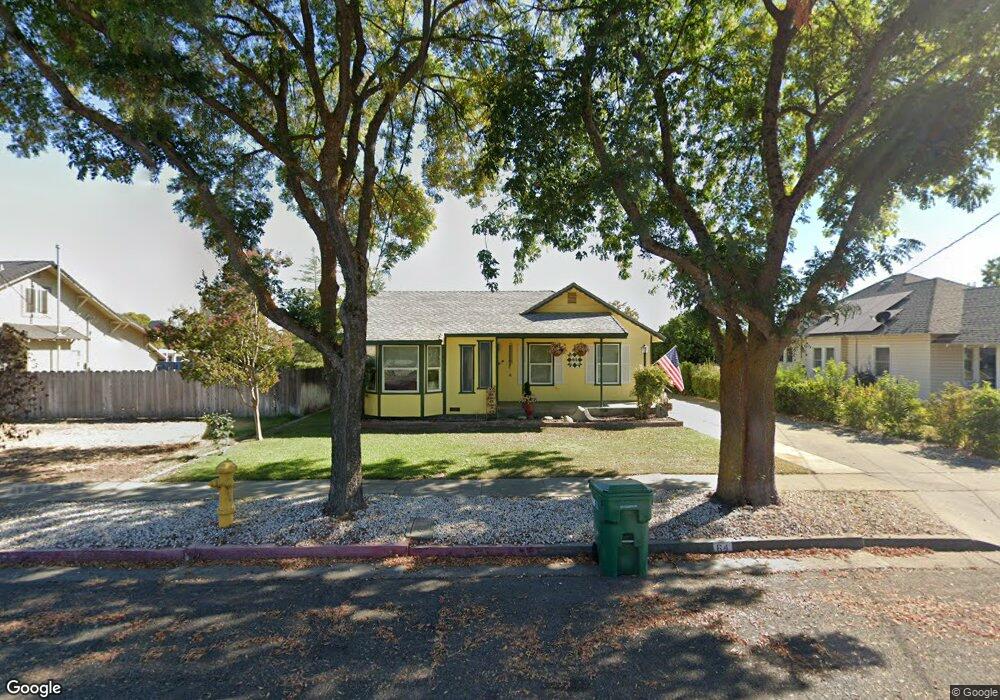
64 E Mill St Orland, CA 95963
Estimated Value: $293,000 - $356,000
3
Beds
2
Baths
1,342
Sq Ft
$242/Sq Ft
Est. Value
About This Home
This home is located at 64 E Mill St, Orland, CA 95963 and is currently estimated at $325,326, approximately $242 per square foot. 64 E Mill St is a home located in Glenn County with nearby schools including Mill Street Elementary School, Fairview Elementary School, and Price Intermediate School.
Ownership History
Date
Name
Owned For
Owner Type
Purchase Details
Closed on
Dec 1, 2012
Sold by
Faver Mikel W and Faver Patricia J
Bought by
Faver Mikel W and Faver Patricia J
Current Estimated Value
Home Financials for this Owner
Home Financials are based on the most recent Mortgage that was taken out on this home.
Original Mortgage
$211,000
Interest Rate
3.27%
Mortgage Type
New Conventional
Purchase Details
Closed on
Apr 20, 2009
Sold by
Faver Mikel W and Faver Patricia J
Bought by
Faver Mikel W and Faver Patricia J
Home Financials for this Owner
Home Financials are based on the most recent Mortgage that was taken out on this home.
Original Mortgage
$211,200
Interest Rate
4.8%
Mortgage Type
Stand Alone Refi Refinance Of Original Loan
Create a Home Valuation Report for This Property
The Home Valuation Report is an in-depth analysis detailing your home's value as well as a comparison with similar homes in the area
Purchase History
| Date | Buyer | Sale Price | Title Company |
|---|---|---|---|
| Faver Mikel W | -- | Orange Coast Title | |
| Faver Mikel W | -- | Orange Coast Title | |
| Faver Mikel | -- | Orange Coast Title |
Source: Public Records
Mortgage History
| Date | Status | Borrower | Loan Amount |
|---|---|---|---|
| Closed | Faver Mikel W | $211,000 | |
| Closed | Faver Mikel | $211,200 |
Source: Public Records
Tax History
| Year | Tax Paid | Tax Assessment Tax Assessment Total Assessment is a certain percentage of the fair market value that is determined by local assessors to be the total taxable value of land and additions on the property. | Land | Improvement |
|---|---|---|---|---|
| 2025 | $1,233 | $116,936 | $17,723 | $99,213 |
| 2024 | $1,233 | $114,644 | $17,376 | $97,268 |
| 2023 | $1,200 | $112,397 | $17,036 | $95,361 |
| 2022 | $1,179 | $110,194 | $16,702 | $93,492 |
| 2021 | $1,178 | $108,034 | $16,375 | $91,659 |
| 2020 | $1,177 | $106,928 | $16,208 | $90,720 |
| 2019 | $1,167 | $104,833 | $15,891 | $88,942 |
| 2018 | $1,091 | $102,779 | $15,580 | $87,199 |
| 2017 | $1,129 | $100,765 | $15,275 | $85,490 |
| 2016 | $1,061 | $98,790 | $14,976 | $83,814 |
| 2015 | $1,044 | $97,308 | $14,752 | $82,556 |
| 2014 | $1,023 | $95,403 | $14,464 | $80,939 |
Source: Public Records
Map
Nearby Homes
Your Personal Tour Guide
Ask me questions while you tour the home.