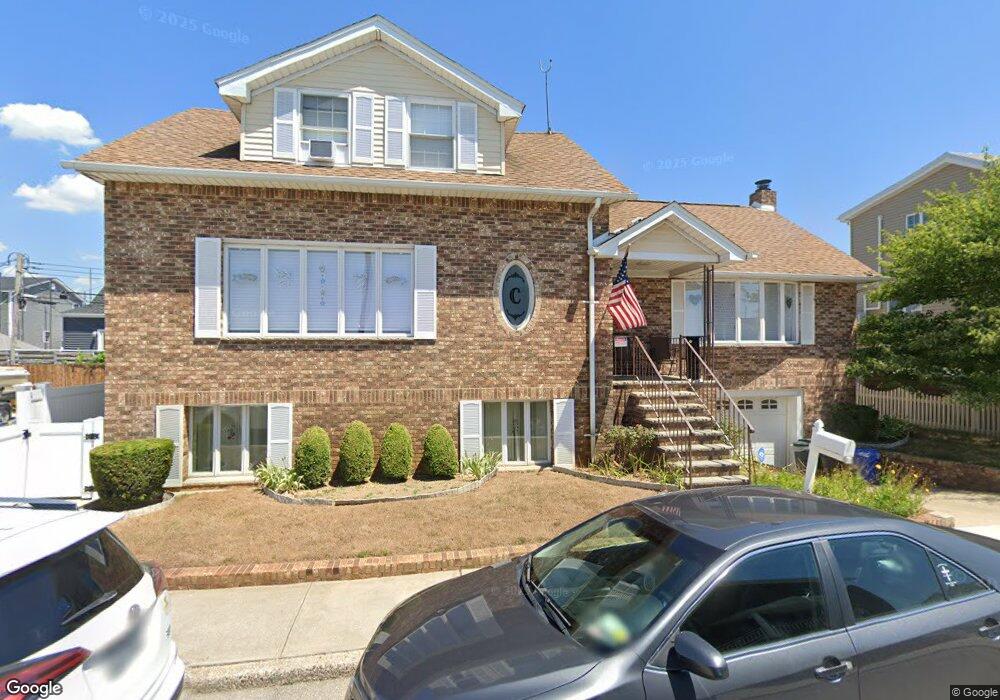
64 Fane Ct Brooklyn, NY 11229
Gerritsen Beach NeighborhoodEstimated Value: $717,000 - $1,108,883
Studio
--
Bath
3,038
Sq Ft
$318/Sq Ft
Est. Value
About This Home
This home is located at 64 Fane Ct, Brooklyn, NY 11229 and is currently estimated at $965,721, approximately $317 per square foot. 64 Fane Ct is a home located in Kings County with nearby schools including P.S. 277 Gerritsen Beach, J.H.S. 278 Marine Park, and New Visions Charter High School for Advanced Math/ Science.
Ownership History
Date
Name
Owned For
Owner Type
Purchase Details
Closed on
Jul 27, 2017
Sold by
Cassidy Dennis Michael and Cassidy Marianne
Bought by
Cassidy Michael
Current Estimated Value
Home Financials for this Owner
Home Financials are based on the most recent Mortgage that was taken out on this home.
Original Mortgage
$375,000
Outstanding Balance
$312,401
Interest Rate
3.9%
Mortgage Type
Purchase Money Mortgage
Estimated Equity
$653,320
Create a Home Valuation Report for This Property
The Home Valuation Report is an in-depth analysis detailing your home's value as well as a comparison with similar homes in the area
Home Values in the Area
Average Home Value in this Area
Purchase History
| Date | Buyer | Sale Price | Title Company |
|---|---|---|---|
| Cassidy Michael | $500,000 | -- |
Source: Public Records
Mortgage History
| Date | Status | Borrower | Loan Amount |
|---|---|---|---|
| Open | Cassidy Michael | $375,000 |
Source: Public Records
Tax History
| Year | Tax Paid | Tax Assessment Tax Assessment Total Assessment is a certain percentage of the fair market value that is determined by local assessors to be the total taxable value of land and additions on the property. | Land | Improvement |
|---|---|---|---|---|
| 2025 | $8,624 | $76,440 | $14,460 | $61,980 |
| 2024 | $8,624 | $60,360 | $14,460 | $45,900 |
| 2023 | $8,227 | $65,700 | $14,460 | $51,240 |
| 2022 | $7,630 | $53,760 | $14,460 | $39,300 |
| 2021 | $7,591 | $41,520 | $14,460 | $27,060 |
| 2019 | $7,485 | $47,400 | $14,460 | $32,940 |
| 2018 | $6,882 | $33,759 | $11,459 | $22,300 |
| 2017 | $4,084 | $31,849 | $11,354 | $20,495 |
| 2016 | $3,637 | $30,060 | $14,460 | $15,600 |
| 2015 | $2,417 | $30,056 | $14,460 | $15,596 |
| 2014 | $2,417 | $29,818 | $14,346 | $15,472 |
Source: Public Records
Map
Nearby Homes
Your Personal Tour Guide
Ask me questions while you tour the home.