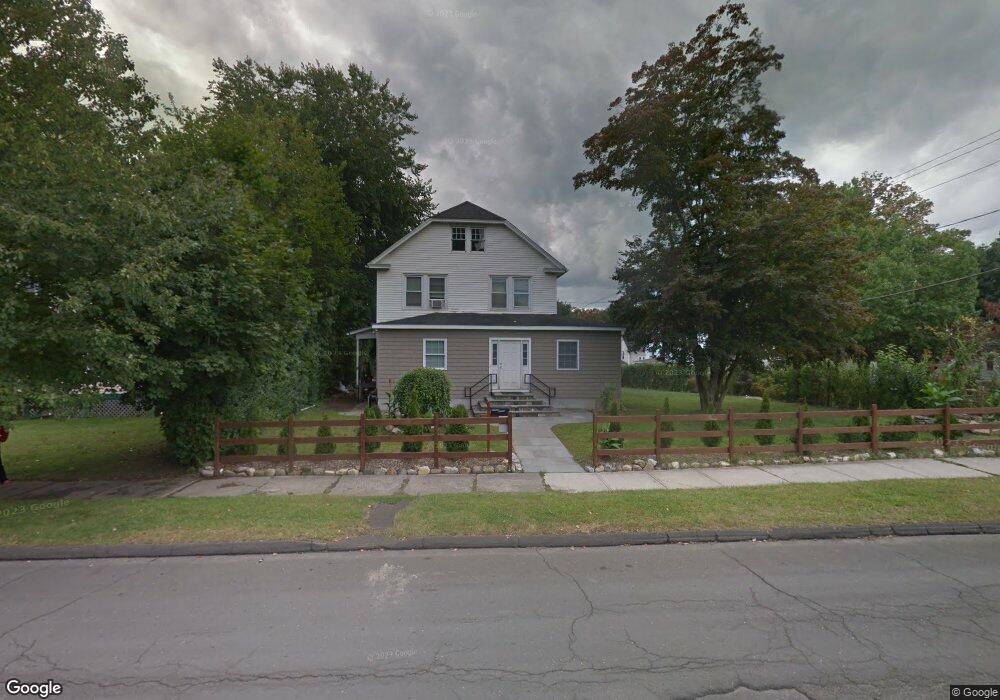
64 Franklin St Danbury, CT 06810
Estimated Value: $443,000 - $628,000
3
Beds
2
Baths
1,830
Sq Ft
$308/Sq Ft
Est. Value
About This Home
This home is located at 64 Franklin St, Danbury, CT 06810 and is currently estimated at $563,150, approximately $307 per square foot. 64 Franklin St is a home located in Fairfield County with nearby schools including King Street Primary School, Broadview Middle School, and Danbury High School.
Ownership History
Date
Name
Owned For
Owner Type
Purchase Details
Closed on
Sep 2, 2009
Sold by
Deutsche Bk
Bought by
Alvarez Franklin
Current Estimated Value
Home Financials for this Owner
Home Financials are based on the most recent Mortgage that was taken out on this home.
Original Mortgage
$196,377
Interest Rate
5.21%
Purchase Details
Closed on
Nov 24, 2008
Sold by
Villango Elena and Villalongo Elena
Bought by
Deutsche Bk
Purchase Details
Closed on
Feb 1, 2006
Sold by
Yankee Redbird Llc
Bought by
Villalongo Elena
Home Financials for this Owner
Home Financials are based on the most recent Mortgage that was taken out on this home.
Original Mortgage
$332,000
Interest Rate
8.25%
Purchase Details
Closed on
Nov 10, 2005
Sold by
Est Scozzafara Joan and Durkin Hugh
Bought by
Yankee Redbird Inc
Create a Home Valuation Report for This Property
The Home Valuation Report is an in-depth analysis detailing your home's value as well as a comparison with similar homes in the area
Home Values in the Area
Average Home Value in this Area
Purchase History
| Date | Buyer | Sale Price | Title Company |
|---|---|---|---|
| Alvarez Franklin | $200,000 | -- | |
| Deutsche Bk | -- | -- | |
| Villalongo Elena | $415,000 | -- | |
| Yankee Redbird Inc | $325,000 | -- |
Source: Public Records
Mortgage History
| Date | Status | Borrower | Loan Amount |
|---|---|---|---|
| Open | Yankee Redbird Inc | $178,500 | |
| Closed | Yankee Redbird Inc | $196,377 | |
| Previous Owner | Yankee Redbird Inc | $332,000 |
Source: Public Records
Tax History
| Year | Tax Paid | Tax Assessment Tax Assessment Total Assessment is a certain percentage of the fair market value that is determined by local assessors to be the total taxable value of land and additions on the property. | Land | Improvement |
|---|---|---|---|---|
| 2025 | $7,440 | $297,710 | $68,880 | $228,830 |
| 2024 | $7,276 | $297,710 | $68,880 | $228,830 |
| 2023 | $6,946 | $297,710 | $68,880 | $228,830 |
| 2022 | $5,404 | $191,500 | $59,300 | $132,200 |
| 2021 | $6,788 | $191,700 | $59,300 | $132,400 |
| 2020 | $5,291 | $191,700 | $59,300 | $132,400 |
| 2019 | $5,291 | $191,700 | $59,300 | $132,400 |
| 2018 | $5,291 | $191,700 | $59,300 | $132,400 |
| 2017 | $6,154 | $137,100 | $56,400 | $80,700 |
| 2016 | $3,932 | $137,100 | $56,400 | $80,700 |
| 2015 | $3,874 | $137,100 | $56,400 | $80,700 |
| 2014 | $3,784 | $137,100 | $56,400 | $80,700 |
Source: Public Records
Map
Nearby Homes
- 8 Ann Dr Unit B
- 22 Robinson Ave
- 18 Grandview Ave
- 23 Franklin St Unit 1
- 34 Mallory St
- 5 -7-9 Patch St
- 67 B Westville Ave
- 22 Irving Place
- 17 Staples St
- 1 Union Ave Unit 11
- 70 Westville Ave
- 59 Pleasant St
- 57 Pleasant St
- 39 Balmforth Ave
- 63A Main St
- 19 Golden Hill Rd
- 26 Walden Ct Unit Lot 6
- 31 William St
- 136 Deer Hill Ave Unit 308
- 26 Crescent Dr
Your Personal Tour Guide
Ask me questions while you tour the home.