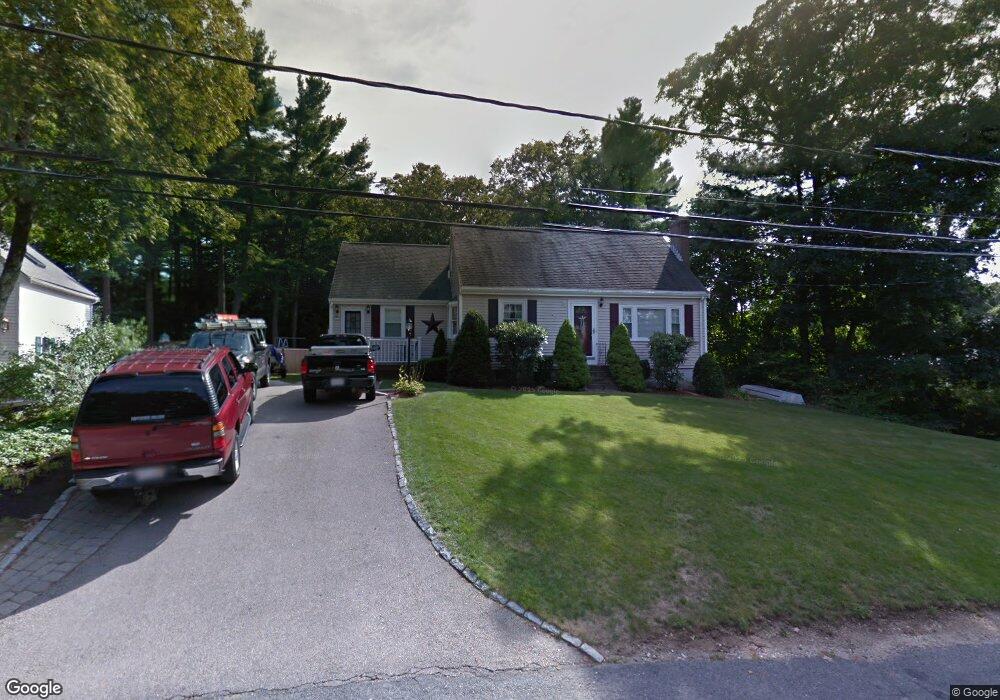
64 Hilltop Dr Millis, MA 02054
Estimated Value: $623,000 - $721,000
4
Beds
3
Baths
1,862
Sq Ft
$370/Sq Ft
Est. Value
About This Home
This home is located at 64 Hilltop Dr, Millis, MA 02054 and is currently estimated at $689,246, approximately $370 per square foot. 64 Hilltop Dr is a home located in Norfolk County with nearby schools including Clyde F Brown, Millis Middle School, and Millis High School.
Ownership History
Date
Name
Owned For
Owner Type
Purchase Details
Closed on
Nov 30, 1990
Sold by
Bennett James A
Bought by
Malzone Frank M
Current Estimated Value
Home Financials for this Owner
Home Financials are based on the most recent Mortgage that was taken out on this home.
Original Mortgage
$120,700
Interest Rate
10.16%
Mortgage Type
Purchase Money Mortgage
Create a Home Valuation Report for This Property
The Home Valuation Report is an in-depth analysis detailing your home's value as well as a comparison with similar homes in the area
Home Values in the Area
Average Home Value in this Area
Purchase History
| Date | Buyer | Sale Price | Title Company |
|---|---|---|---|
| Malzone Frank M | $153,900 | -- |
Source: Public Records
Mortgage History
| Date | Status | Borrower | Loan Amount |
|---|---|---|---|
| Open | Malzone Frank M | $154,000 | |
| Closed | Malzone Frank M | $125,000 | |
| Closed | Malzone Frank M | $120,700 |
Source: Public Records
Tax History
| Year | Tax Paid | Tax Assessment Tax Assessment Total Assessment is a certain percentage of the fair market value that is determined by local assessors to be the total taxable value of land and additions on the property. | Land | Improvement |
|---|---|---|---|---|
| 2025 | $10,773 | $656,900 | $232,500 | $424,400 |
| 2024 | $9,900 | $602,900 | $214,600 | $388,300 |
| 2023 | $9,310 | $532,300 | $171,100 | $361,200 |
| 2022 | $9,117 | $482,900 | $183,500 | $299,400 |
| 2021 | $8,397 | $428,000 | $158,600 | $269,400 |
| 2020 | $8,709 | $432,400 | $148,300 | $284,100 |
| 2019 | $7,603 | $406,600 | $135,100 | $271,500 |
| 2018 | $7,327 | $406,600 | $135,100 | $271,500 |
| 2017 | $6,504 | $353,100 | $115,400 | $237,700 |
| 2016 | $6,158 | $353,100 | $115,400 | $237,700 |
| 2015 | $5,891 | $346,500 | $115,400 | $231,100 |
Source: Public Records
Map
Nearby Homes
Your Personal Tour Guide
Ask me questions while you tour the home.