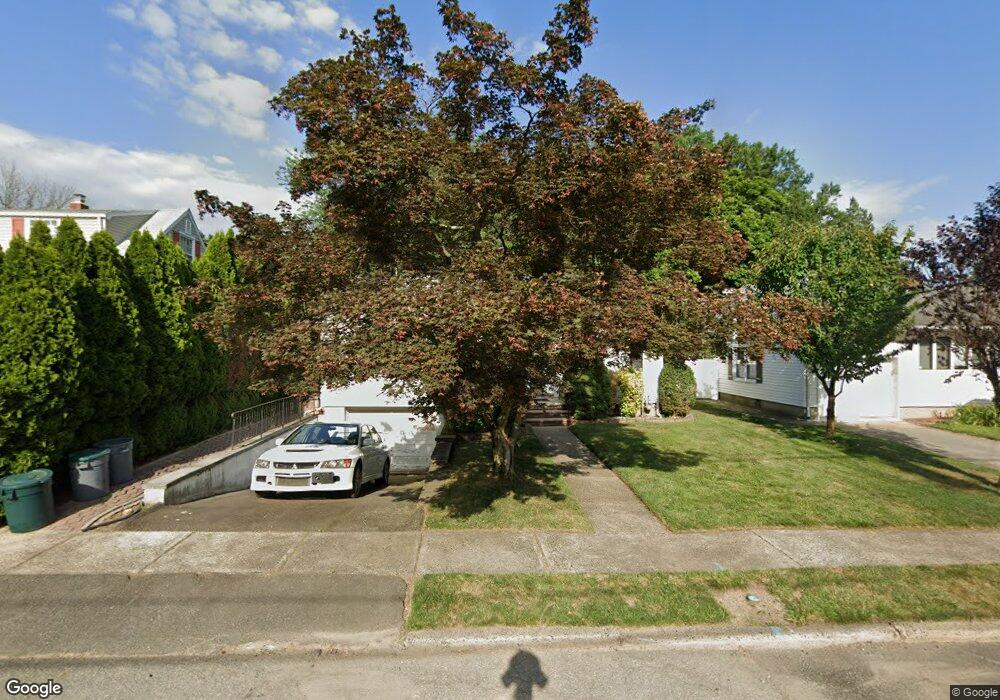
64 Jacob St Bloomfield, NJ 07003
Estimated Value: $547,194 - $761,000
Studio
--
Bath
1,044
Sq Ft
$592/Sq Ft
Est. Value
About This Home
This home is located at 64 Jacob St, Bloomfield, NJ 07003 and is currently estimated at $618,299, approximately $592 per square foot. 64 Jacob St is a home located in Essex County with nearby schools including Brookdale School, Bloomfield Middle School, and Bloomfield High School.
Ownership History
Date
Name
Owned For
Owner Type
Purchase Details
Closed on
Jun 13, 2005
Sold by
Delvalle Luis
Bought by
Clarin Alan and Clarin Yaadora
Current Estimated Value
Home Financials for this Owner
Home Financials are based on the most recent Mortgage that was taken out on this home.
Original Mortgage
$299,110
Outstanding Balance
$167,140
Interest Rate
6.87%
Mortgage Type
Adjustable Rate Mortgage/ARM
Estimated Equity
$451,159
Purchase Details
Closed on
May 20, 1997
Sold by
Fettman Norman
Bought by
Zhang Hailing and Zhang Hong
Home Financials for this Owner
Home Financials are based on the most recent Mortgage that was taken out on this home.
Original Mortgage
$142,000
Interest Rate
7.97%
Create a Home Valuation Report for This Property
The Home Valuation Report is an in-depth analysis detailing your home's value as well as a comparison with similar homes in the area
Home Values in the Area
Average Home Value in this Area
Purchase History
| Date | Buyer | Sale Price | Title Company |
|---|---|---|---|
| Clarin Alan | $427,300 | -- | |
| Zhang Hailing | $162,000 | -- |
Source: Public Records
Mortgage History
| Date | Status | Borrower | Loan Amount |
|---|---|---|---|
| Open | Clarin Alan | $299,110 | |
| Previous Owner | Zhang Hailing | $142,000 |
Source: Public Records
Tax History
| Year | Tax Paid | Tax Assessment Tax Assessment Total Assessment is a certain percentage of the fair market value that is determined by local assessors to be the total taxable value of land and additions on the property. | Land | Improvement |
|---|---|---|---|---|
| 2025 | $12,455 | $367,200 | $182,700 | $184,500 |
| 2024 | $12,000 | $367,200 | $182,700 | $184,500 |
| 2022 | $11,758 | $367,200 | $182,700 | $184,500 |
| 2021 | $11,541 | $367,200 | $182,700 | $184,500 |
| 2020 | $11,365 | $367,200 | $182,700 | $184,500 |
| 2019 | $10,980 | $275,800 | $161,000 | $114,800 |
| 2018 | $10,933 | $275,800 | $161,000 | $114,800 |
| 2017 | $10,767 | $275,800 | $161,000 | $114,800 |
| 2016 | $10,646 | $275,800 | $161,000 | $114,800 |
| 2015 | $10,549 | $275,800 | $161,000 | $114,800 |
| 2014 | $10,356 | $275,800 | $161,000 | $114,800 |
Source: Public Records
Map
Nearby Homes
- 1552 Broad St Rear
- 33 Tuers Place
- 40 Golf Rd
- 112 Heller Way
- 45 Wells Ct
- 5 Bellevue Ave
- 24 Malcolm Ct
- 117 Yantacaw Brook Rd
- 34 Carline Dr
- 11 Kenneth Rd
- 3 Hyde Rd
- 3 Collins Ave
- 70 Anderson Dr
- 66 Lockwood Place
- 18 Roy Ct
- 35 Chanda Ct Unit D035
- 35 Chanda Ct
- 37 Chanda Ct
- 37 Chanda Ct Unit D037
- 34 Chanda Ct
Your Personal Tour Guide
Ask me questions while you tour the home.