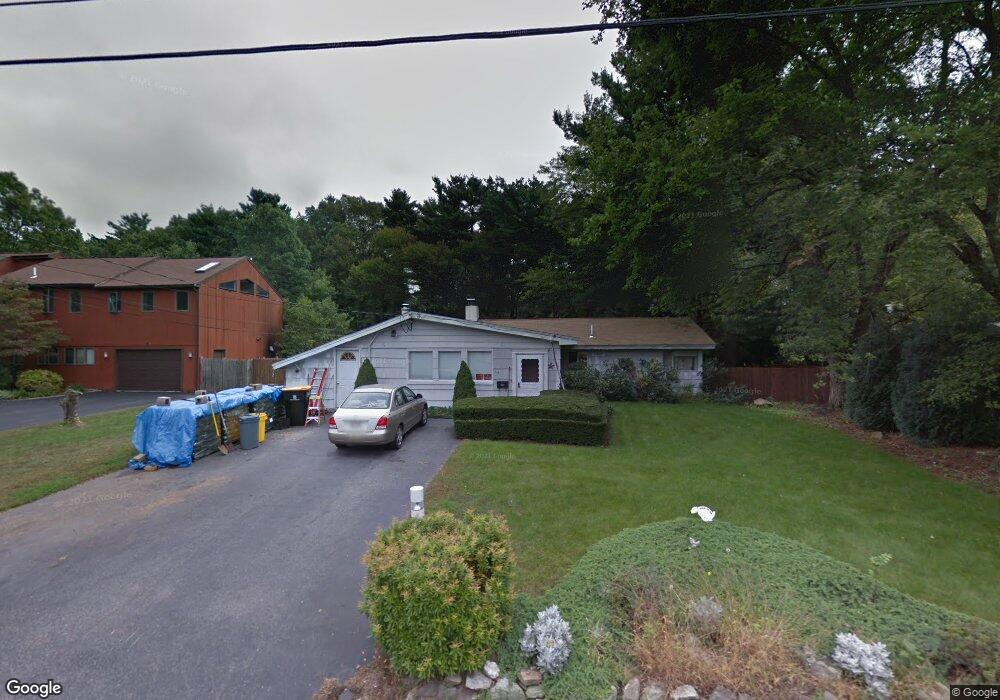
64 Joseph Rd Framingham, MA 01701
Nobscot NeighborhoodEstimated Value: $626,000 - $697,000
3
Beds
2
Baths
1,885
Sq Ft
$349/Sq Ft
Est. Value
About This Home
This home is located at 64 Joseph Rd, Framingham, MA 01701 and is currently estimated at $657,154, approximately $348 per square foot. 64 Joseph Rd is a home located in Middlesex County with nearby schools including Framingham High School and MetroWest Jewish Day School.
Ownership History
Date
Name
Owned For
Owner Type
Purchase Details
Closed on
Jul 16, 1993
Sold by
Dime Sb Ny
Bought by
Mclean Roderick N and Mclean Donna
Current Estimated Value
Home Financials for this Owner
Home Financials are based on the most recent Mortgage that was taken out on this home.
Original Mortgage
$117,900
Interest Rate
7.4%
Mortgage Type
Purchase Money Mortgage
Purchase Details
Closed on
Oct 30, 1991
Sold by
Levy Joseph
Bought by
Garden Mgmt Co Inc
Purchase Details
Closed on
Apr 7, 1987
Sold by
Bock Robert L
Bought by
Levy Joseph
Home Financials for this Owner
Home Financials are based on the most recent Mortgage that was taken out on this home.
Original Mortgage
$135,000
Interest Rate
9.11%
Mortgage Type
Purchase Money Mortgage
Create a Home Valuation Report for This Property
The Home Valuation Report is an in-depth analysis detailing your home's value as well as a comparison with similar homes in the area
Home Values in the Area
Average Home Value in this Area
Purchase History
| Date | Buyer | Sale Price | Title Company |
|---|---|---|---|
| Mclean Roderick N | $131,000 | -- | |
| Mclean Roderick N | $131,000 | -- | |
| Garden Mgmt Co Inc | $125,000 | -- | |
| Garden Mgmt Co Inc | $125,000 | -- | |
| Levy Joseph | $182,500 | -- |
Source: Public Records
Mortgage History
| Date | Status | Borrower | Loan Amount |
|---|---|---|---|
| Closed | Levy Joseph | $117,900 | |
| Previous Owner | Levy Joseph | $135,000 |
Source: Public Records
Tax History
| Year | Tax Paid | Tax Assessment Tax Assessment Total Assessment is a certain percentage of the fair market value that is determined by local assessors to be the total taxable value of land and additions on the property. | Land | Improvement |
|---|---|---|---|---|
| 2025 | $6,695 | $560,700 | $271,100 | $289,600 |
| 2024 | $6,337 | $508,600 | $242,200 | $266,400 |
| 2023 | $6,025 | $460,300 | $216,100 | $244,200 |
| 2022 | $5,712 | $415,700 | $196,100 | $219,600 |
| 2021 | $5,567 | $396,200 | $188,500 | $207,700 |
| 2020 | $5,582 | $372,600 | $171,300 | $201,300 |
| 2019 | $5,463 | $355,200 | $171,300 | $183,900 |
| 2018 | $5,335 | $326,900 | $164,900 | $162,000 |
| 2017 | $5,207 | $311,600 | $160,100 | $151,500 |
| 2016 | $5,052 | $290,700 | $160,100 | $130,600 |
| 2015 | $5,089 | $285,600 | $160,700 | $124,900 |
Source: Public Records
Map
Nearby Homes
Your Personal Tour Guide
Ask me questions while you tour the home.