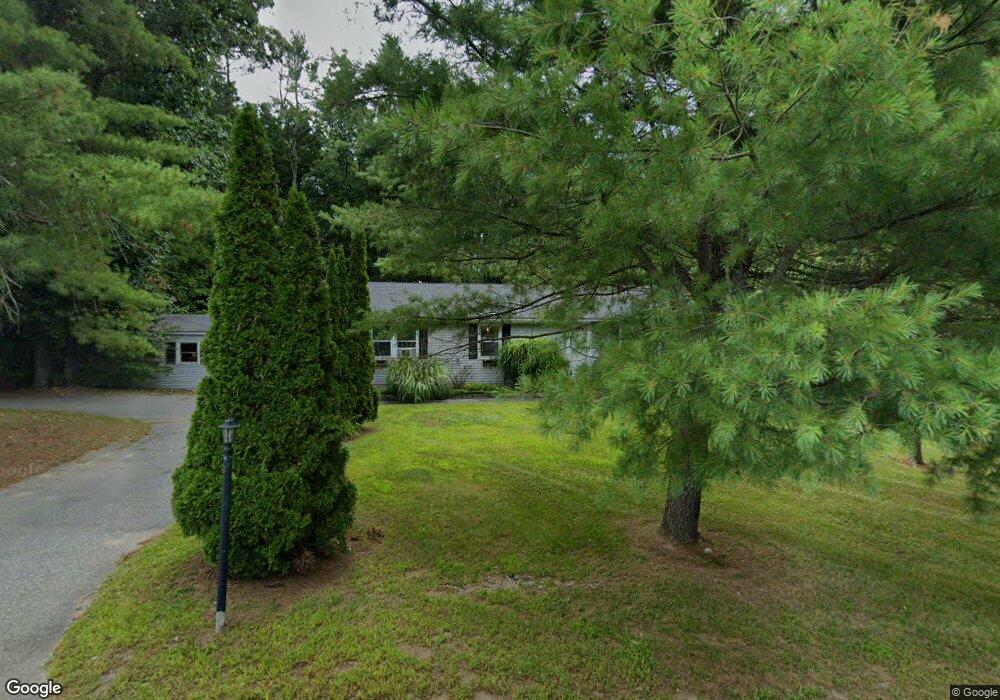
64 Main St Fremont, NH 03044
Estimated Value: $449,000 - $519,592
3
Beds
2
Baths
1,344
Sq Ft
$364/Sq Ft
Est. Value
About This Home
This home is located at 64 Main St, Fremont, NH 03044 and is currently estimated at $489,398, approximately $364 per square foot. 64 Main St is a home located in Rockingham County with nearby schools including Ellis School.
Ownership History
Date
Name
Owned For
Owner Type
Purchase Details
Closed on
Dec 4, 2001
Sold by
Mission Glenn A and Mission Joann M
Bought by
Abbott Wendi
Current Estimated Value
Home Financials for this Owner
Home Financials are based on the most recent Mortgage that was taken out on this home.
Original Mortgage
$153,000
Interest Rate
6.66%
Purchase Details
Closed on
Apr 11, 1996
Sold by
Murphy Charles F and Murphy Gayle J
Bought by
Mission Glenn A and Mission Joann M
Home Financials for this Owner
Home Financials are based on the most recent Mortgage that was taken out on this home.
Original Mortgage
$107,900
Interest Rate
7.39%
Create a Home Valuation Report for This Property
The Home Valuation Report is an in-depth analysis detailing your home's value as well as a comparison with similar homes in the area
Home Values in the Area
Average Home Value in this Area
Purchase History
| Date | Buyer | Sale Price | Title Company |
|---|---|---|---|
| Abbott Wendi | $175,000 | -- | |
| Mission Glenn A | $108,000 | -- |
Source: Public Records
Mortgage History
| Date | Status | Borrower | Loan Amount |
|---|---|---|---|
| Open | Mission Glenn A | $160,800 | |
| Closed | Mission Glenn A | $37,193 | |
| Closed | Mission Glenn A | $153,000 | |
| Previous Owner | Mission Glenn A | $107,900 |
Source: Public Records
Tax History Compared to Growth
Tax History
| Year | Tax Paid | Tax Assessment Tax Assessment Total Assessment is a certain percentage of the fair market value that is determined by local assessors to be the total taxable value of land and additions on the property. | Land | Improvement |
|---|---|---|---|---|
| 2024 | $6,769 | $256,700 | $90,000 | $166,700 |
| 2023 | $6,056 | $256,700 | $90,000 | $166,700 |
| 2022 | $5,953 | $256,700 | $90,000 | $166,700 |
| 2021 | $5,727 | $256,600 | $90,000 | $166,600 |
| 2020 | $7,231 | $256,600 | $90,000 | $166,600 |
| 2019 | $6,083 | $195,900 | $76,700 | $119,200 |
| 2018 | $5,650 | $195,900 | $76,700 | $119,200 |
| 2017 | $4,942 | $195,900 | $76,700 | $119,200 |
| 2016 | $9,467 | $195,900 | $76,700 | $119,200 |
| 2015 | $5,681 | $195,900 | $76,700 | $119,200 |
| 2014 | $5,686 | $201,500 | $76,700 | $124,800 |
| 2013 | $5,745 | $201,500 | $76,700 | $124,800 |
Source: Public Records
Map
Nearby Homes