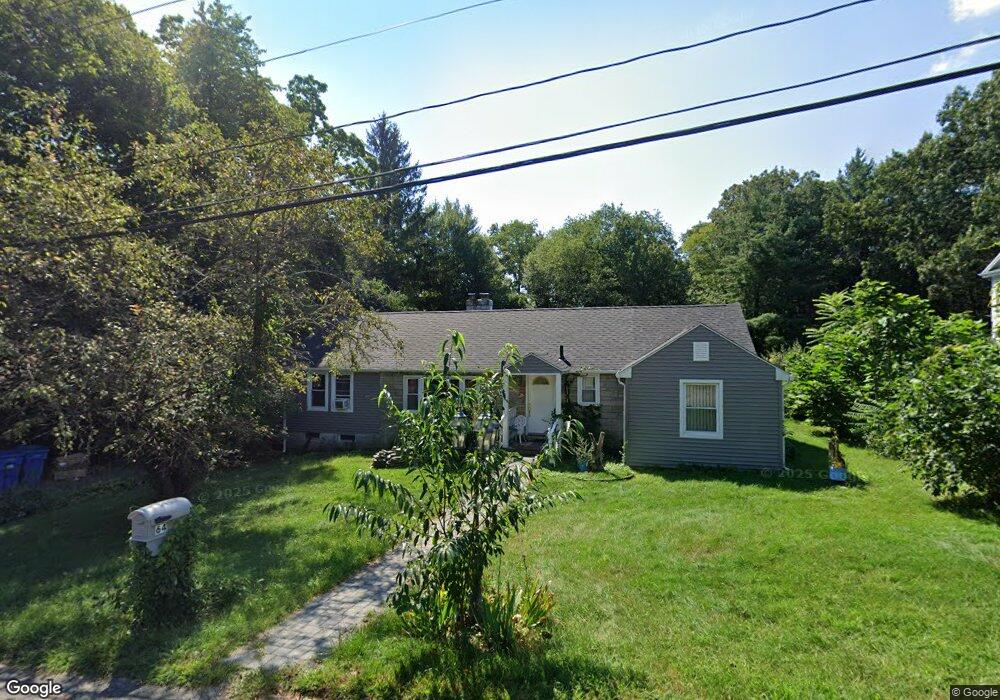
64 Matteson St Waterbury, CT 06705
East End District NeighborhoodEstimated Value: $339,000 - $414,000
4
Beds
2
Baths
1,681
Sq Ft
$220/Sq Ft
Est. Value
About This Home
This home is located at 64 Matteson St, Waterbury, CT 06705 and is currently estimated at $370,270, approximately $220 per square foot. 64 Matteson St is a home located in New Haven County with nearby schools including Margaret M. Generali Elementary School, Michael F. Wallace Middle School, and Crosby High School.
Ownership History
Date
Name
Owned For
Owner Type
Purchase Details
Closed on
Nov 25, 1998
Sold by
Fdic
Bought by
Mete Shpetim and Mete Meleke
Current Estimated Value
Home Financials for this Owner
Home Financials are based on the most recent Mortgage that was taken out on this home.
Original Mortgage
$55,900
Interest Rate
6.85%
Create a Home Valuation Report for This Property
The Home Valuation Report is an in-depth analysis detailing your home's value as well as a comparison with similar homes in the area
Home Values in the Area
Average Home Value in this Area
Purchase History
| Date | Buyer | Sale Price | Title Company |
|---|---|---|---|
| Mete Shpetim | $50,500 | -- |
Source: Public Records
Mortgage History
| Date | Status | Borrower | Loan Amount |
|---|---|---|---|
| Open | Mete Shpetim | $211,850 | |
| Closed | Mete Shpetim | $93,500 | |
| Closed | Mete Shpetim | $85,000 | |
| Closed | Mete Shpetim | $55,900 |
Source: Public Records
Tax History Compared to Growth
Tax History
| Year | Tax Paid | Tax Assessment Tax Assessment Total Assessment is a certain percentage of the fair market value that is determined by local assessors to be the total taxable value of land and additions on the property. | Land | Improvement |
|---|---|---|---|---|
| 2025 | $8,986 | $199,780 | $55,860 | $143,920 |
| 2024 | $9,877 | $199,780 | $55,860 | $143,920 |
| 2023 | $10,826 | $199,780 | $55,860 | $143,920 |
| 2022 | $7,875 | $130,800 | $55,870 | $74,930 |
| 2021 | $7,875 | $130,800 | $55,870 | $74,930 |
| 2020 | $7,875 | $130,800 | $55,870 | $74,930 |
| 2019 | $7,875 | $130,800 | $55,870 | $74,930 |
| 2018 | $7,875 | $130,800 | $55,870 | $74,930 |
| 2017 | $6,422 | $106,660 | $27,930 | $78,730 |
| 2016 | $6,422 | $106,660 | $27,930 | $78,730 |
| 2015 | $6,210 | $106,660 | $27,930 | $78,730 |
| 2014 | $6,210 | $106,660 | $27,930 | $78,730 |
Source: Public Records
Map
Nearby Homes
- 3280 E Main St
- 38 Mapleridge Dr
- 519 Scott Rd Unit 60
- 30 Woodglen Dr Unit 7B2
- 380 Hitchcock Rd Unit 272
- 380 Hitchcock Rd Unit 206
- 380 Hitchcock Rd Unit 48
- 380 Hitchcock Rd Unit 112
- 380 Hitchcock Rd Unit 227
- 61 Bentwood Dr Unit 5
- 10 W Ridge Ct
- 135 Norris St
- 1400 Meriden Rd Unit 6-5
- 49 Birchfield Dr
- 425 Scott Rd
- 541 Pierpont Rd Unit 2
- 541 Pierpont Rd Unit 9
- 2916 E Main St
- 379 Scott Rd
- 1190 Meriden Rd