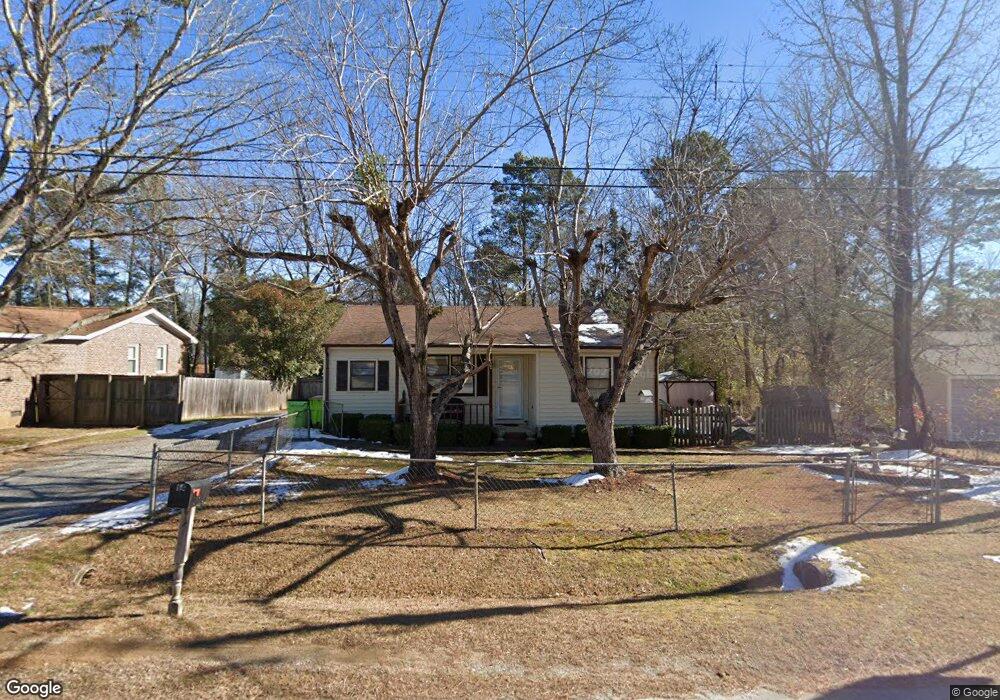
64 Mobley St Roanoke Rapids, NC 27870
Estimated Value: $84,905 - $112,000
2
Beds
1
Bath
888
Sq Ft
$110/Sq Ft
Est. Value
About This Home
This home is located at 64 Mobley St, Roanoke Rapids, NC 27870 and is currently estimated at $97,726, approximately $110 per square foot. 64 Mobley St is a home located in Halifax County with nearby schools including Roanoke Rapids High School, Victory Christian Academy, and Gingerbread House.
Ownership History
Date
Name
Owned For
Owner Type
Purchase Details
Closed on
Aug 23, 2006
Sold by
Bolt Rufus F and Bolt Fonda M
Bought by
Motlet Joel T
Current Estimated Value
Home Financials for this Owner
Home Financials are based on the most recent Mortgage that was taken out on this home.
Original Mortgage
$71,000
Outstanding Balance
$41,434
Interest Rate
6.25%
Mortgage Type
New Conventional
Estimated Equity
$56,292
Purchase Details
Closed on
Apr 5, 2006
Sold by
Stone Brett J and Stone Donna B
Bought by
Bolt Rufus F
Create a Home Valuation Report for This Property
The Home Valuation Report is an in-depth analysis detailing your home's value as well as a comparison with similar homes in the area
Purchase History
| Date | Buyer | Sale Price | Title Company |
|---|---|---|---|
| Motlet Joel T | $70,000 | None Available | |
| Bolt Rufus F | $31,172 | None Available |
Source: Public Records
Mortgage History
| Date | Status | Borrower | Loan Amount |
|---|---|---|---|
| Open | Motlet Joel T | $71,000 |
Source: Public Records
Tax History
| Year | Tax Paid | Tax Assessment Tax Assessment Total Assessment is a certain percentage of the fair market value that is determined by local assessors to be the total taxable value of land and additions on the property. | Land | Improvement |
|---|---|---|---|---|
| 2025 | $8 | $52,100 | $5,900 | $46,200 |
| 2024 | $8 | $52,100 | $5,900 | $46,200 |
| 2023 | $649 | $39,200 | $5,900 | $33,300 |
| 2022 | $664 | $39,200 | $5,900 | $33,300 |
| 2021 | $640 | $39,200 | $5,900 | $33,300 |
| 2020 | $641 | $39,200 | $5,900 | $33,300 |
| 2019 | $611 | $35,700 | $5,900 | $29,800 |
| 2018 | $598 | $35,700 | $5,900 | $29,800 |
| 2017 | $600 | $35,700 | $5,900 | $29,800 |
| 2016 | $608 | $35,700 | $5,900 | $29,800 |
| 2015 | $577 | $35,700 | $5,900 | $29,800 |
| 2014 | $582 | $39,210 | $7,390 | $31,820 |
Source: Public Records
Map
Nearby Homes
Your Personal Tour Guide
Ask me questions while you tour the home.