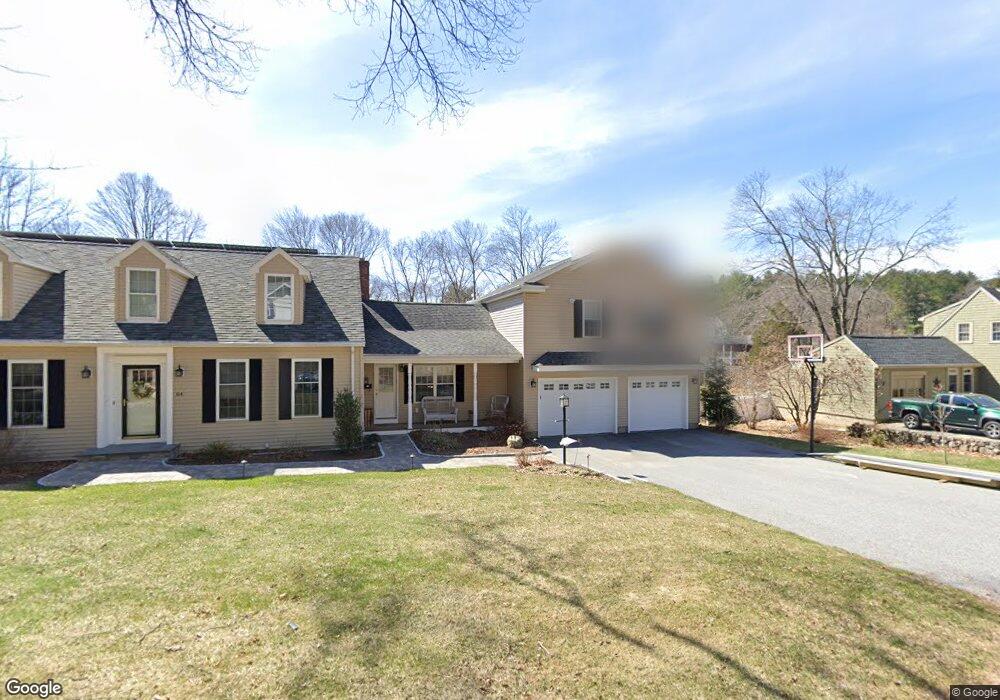
64 Mountain St Woburn, MA 01801
North Woburn NeighborhoodEstimated Value: $1,040,000 - $1,168,000
5
Beds
3
Baths
2,917
Sq Ft
$373/Sq Ft
Est. Value
About This Home
This home is located at 64 Mountain St, Woburn, MA 01801 and is currently estimated at $1,086,835, approximately $372 per square foot. 64 Mountain St is a home located in Middlesex County with nearby schools including Mary D. Altavesta Elementary School, John F. Kennedy Middle School, and Woburn High School.
Ownership History
Date
Name
Owned For
Owner Type
Purchase Details
Closed on
Mar 19, 2019
Sold by
Dionne Paul E and Dionne Anne L
Bought by
Dionne Michael E and Dionne Karen A
Current Estimated Value
Home Financials for this Owner
Home Financials are based on the most recent Mortgage that was taken out on this home.
Original Mortgage
$335,000
Outstanding Balance
$293,924
Interest Rate
4.4%
Mortgage Type
New Conventional
Estimated Equity
$792,911
Purchase Details
Closed on
Apr 7, 1978
Bought by
Dionne Paul E
Create a Home Valuation Report for This Property
The Home Valuation Report is an in-depth analysis detailing your home's value as well as a comparison with similar homes in the area
Home Values in the Area
Average Home Value in this Area
Purchase History
| Date | Buyer | Sale Price | Title Company |
|---|---|---|---|
| Dionne Michael E | $750,000 | -- | |
| Dionne Michael E | $750,000 | -- | |
| Dionne Michael E | $750,000 | -- | |
| Dionne Paul E | -- | -- |
Source: Public Records
Mortgage History
| Date | Status | Borrower | Loan Amount |
|---|---|---|---|
| Open | Dionne Michael E | $335,000 | |
| Closed | Dionne Michael E | $335,000 | |
| Previous Owner | Dionne Paul E | $85,000 |
Source: Public Records
Tax History Compared to Growth
Tax History
| Year | Tax Paid | Tax Assessment Tax Assessment Total Assessment is a certain percentage of the fair market value that is determined by local assessors to be the total taxable value of land and additions on the property. | Land | Improvement |
|---|---|---|---|---|
| 2025 | $8,002 | $937,000 | $348,200 | $588,800 |
| 2024 | $7,198 | $893,000 | $332,200 | $560,800 |
| 2023 | $7,066 | $812,200 | $302,100 | $510,100 |
| 2022 | $6,948 | $743,900 | $264,300 | $479,600 |
| 2021 | $6,545 | $701,500 | $252,300 | $449,200 |
| 2020 | $6,250 | $670,600 | $252,300 | $418,300 |
| 2019 | $6,127 | $644,900 | $240,900 | $404,000 |
| 2018 | $5,931 | $599,700 | $222,000 | $377,700 |
| 2017 | $5,517 | $555,000 | $212,100 | $342,900 |
| 2016 | $5,445 | $541,800 | $199,000 | $342,800 |
| 2015 | $5,349 | $526,000 | $186,800 | $339,200 |
| 2014 | $4,799 | $459,700 | $186,800 | $272,900 |
Source: Public Records
Map
Nearby Homes
- 6 Kendal Dr
- 23 Ward St Unit A
- 26 E Dexter Ave
- 6R & 6 Tidd Ave
- 6 Tidd Ave
- 16 Sunnyside Rd
- 28 Van Norden Rd
- 21 Spring Valley Rd
- 38 Freeport Dr
- 210 Winn St
- 104 Forest Park Rd
- 82 Lowell St
- 6 Callahan Dr
- 0 Johnson Rd
- 3 Highet Ave
- 4 Ardmore Ave
- 29 Grove Ln Unit 29
- 3 Hart St
- 129 Cambridge St Unit 1
- 50 Hill Cir