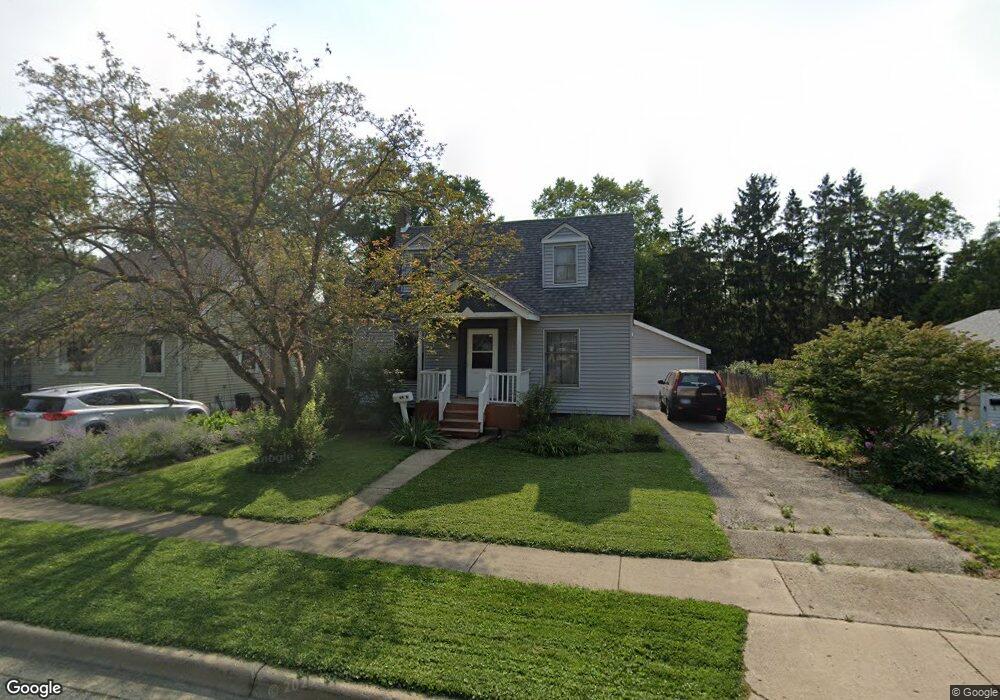
64 N Pershing Ave Mundelein, IL 60060
Estimated Value: $255,225 - $286,000
--
Bed
2
Baths
1,008
Sq Ft
$271/Sq Ft
Est. Value
About This Home
This home is located at 64 N Pershing Ave, Mundelein, IL 60060 and is currently estimated at $273,306, approximately $271 per square foot. 64 N Pershing Ave is a home located in Lake County with nearby schools including Washington Early Learning Center, Mechanics Grove Elementary School, and Carl Sandburg Middle School.
Ownership History
Date
Name
Owned For
Owner Type
Purchase Details
Closed on
Jan 28, 2014
Sold by
Dejean Susan and Catini Celeste
Bought by
Dejean Susan and Catini Celeste
Current Estimated Value
Purchase Details
Closed on
Aug 13, 2009
Sold by
Dejean Susan
Bought by
Dejean Susan and Catini Angela
Create a Home Valuation Report for This Property
The Home Valuation Report is an in-depth analysis detailing your home's value as well as a comparison with similar homes in the area
Home Values in the Area
Average Home Value in this Area
Purchase History
| Date | Buyer | Sale Price | Title Company |
|---|---|---|---|
| Dejean Susan | -- | None Available | |
| Dejean Susan | -- | None Available |
Source: Public Records
Tax History Compared to Growth
Tax History
| Year | Tax Paid | Tax Assessment Tax Assessment Total Assessment is a certain percentage of the fair market value that is determined by local assessors to be the total taxable value of land and additions on the property. | Land | Improvement |
|---|---|---|---|---|
| 2024 | $6,131 | $71,741 | $16,558 | $55,183 |
| 2023 | $5,917 | $65,733 | $15,171 | $50,562 |
| 2022 | $5,917 | $61,003 | $14,530 | $46,473 |
| 2021 | $5,651 | $58,866 | $14,021 | $44,845 |
| 2020 | $5,552 | $57,246 | $13,635 | $43,611 |
| 2019 | $5,369 | $55,364 | $13,187 | $42,177 |
| 2018 | $4,807 | $50,232 | $12,480 | $37,752 |
| 2017 | $4,741 | $48,651 | $12,087 | $36,564 |
| 2016 | $4,603 | $46,207 | $11,480 | $34,727 |
| 2015 | $4,468 | $43,318 | $10,762 | $32,556 |
| 2014 | $4,468 | $42,541 | $10,667 | $31,874 |
| 2012 | $4,442 | $42,919 | $10,762 | $32,157 |
Source: Public Records
Map
Nearby Homes
- 207 N Idlewild Ave
- 116 S Pershing Ave
- 250 N Fairlawn Ave
- 1297 Spalding Dr
- 1305 Spalding Dr
- 29746 U S 45
- 26220 N Midlothian Rd
- 547 N Ridgemoor Ave
- 201 Bingham Cir
- 208 Bingham Cir
- 26980 N Pierre Dr
- 619 N California Ave Unit 1
- 851 Glenview Ave
- 1360 Edington Ln
- 19925 W Il Route 60
- 331 Plaza Cir
- 123 Dunton Ct
- 728 W Maple Ave
- 26892 N Iride Dr
- 742 N Lake St
- 58 N Pershing Ave
- 70 N Pershing Ave
- 52 N Pershing Ave
- 61 N California Ave
- 55 N California Ave
- 69 N California Ave
- 106 N Pershing Ave
- 49 N California Ave
- 610 W Courtland St
- 616 W Courtland St
- 604 W Courtland St
- 63 N Pershing Ave
- 533 W Crystal St
- 622 W Courtland St
- 51 N Pershing Ave
- 600 W Crystal St
- 628 W Courtland St
- 116 N Pershing Ave
- 534 W Courtland St
- 528 W Crystal St