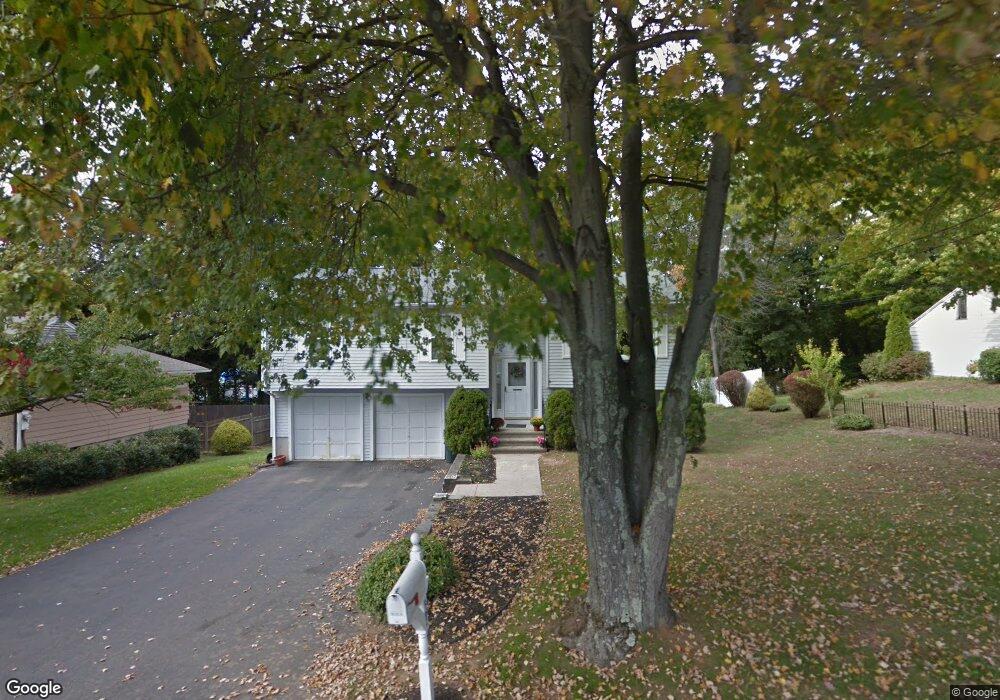
64 Paul St New Haven, CT 06513
Estimated Value: $378,000 - $433,660
4
Beds
4
Baths
1,184
Sq Ft
$338/Sq Ft
Est. Value
About This Home
This home is located at 64 Paul St, New Haven, CT 06513 and is currently estimated at $400,415, approximately $338 per square foot. 64 Paul St is a home located in New Haven County with nearby schools including Deer Run School, East Haven High School, and All Nations Christian Academy.
Ownership History
Date
Name
Owned For
Owner Type
Purchase Details
Closed on
Jul 30, 2025
Sold by
Criscio Marc T and Criscio Dean A
Bought by
Criscio Dean A
Current Estimated Value
Purchase Details
Closed on
Mar 3, 2022
Sold by
Criscio Marie A and Criscio Dean A
Bought by
Criscio Dean A and Criscio Marc T
Purchase Details
Closed on
May 2, 2013
Sold by
Criscio Salvatore A
Bought by
Criscio Marie A
Home Financials for this Owner
Home Financials are based on the most recent Mortgage that was taken out on this home.
Original Mortgage
$0
Interest Rate
3.35%
Purchase Details
Closed on
Sep 5, 1995
Sold by
Dale Constr Inc
Bought by
Criscio Salvatore A and Criscio Dean A
Home Financials for this Owner
Home Financials are based on the most recent Mortgage that was taken out on this home.
Original Mortgage
$121,950
Interest Rate
7.61%
Mortgage Type
Purchase Money Mortgage
Create a Home Valuation Report for This Property
The Home Valuation Report is an in-depth analysis detailing your home's value as well as a comparison with similar homes in the area
Home Values in the Area
Average Home Value in this Area
Purchase History
| Date | Buyer | Sale Price | Title Company |
|---|---|---|---|
| Criscio Dean A | $42,500 | -- | |
| Criscio Dean A | -- | None Available | |
| Criscio Dean A | -- | None Available | |
| Criscio Marie A | -- | -- | |
| Criscio Marie A | -- | -- | |
| Criscio Salvatore A | $128,400 | -- | |
| Criscio Salvatore A | $128,400 | -- |
Source: Public Records
Mortgage History
| Date | Status | Borrower | Loan Amount |
|---|---|---|---|
| Previous Owner | Criscio Salvatore A | $0 | |
| Previous Owner | Criscio Salvatore A | $121,950 |
Source: Public Records
Tax History Compared to Growth
Tax History
| Year | Tax Paid | Tax Assessment Tax Assessment Total Assessment is a certain percentage of the fair market value that is determined by local assessors to be the total taxable value of land and additions on the property. | Land | Improvement |
|---|---|---|---|---|
| 2025 | $6,156 | $184,100 | $40,110 | $143,990 |
| 2024 | $6,156 | $184,100 | $40,110 | $143,990 |
| 2023 | $5,744 | $184,100 | $40,110 | $143,990 |
| 2022 | $5,744 | $184,100 | $40,110 | $143,990 |
| 2021 | $4,918 | $143,590 | $33,420 | $110,170 |
| 2020 | $4,801 | $140,180 | $33,420 | $106,760 |
| 2019 | $4,545 | $140,180 | $33,420 | $106,760 |
| 2018 | $4,549 | $140,180 | $33,420 | $106,760 |
| 2017 | $4,423 | $140,180 | $33,420 | $106,760 |
| 2016 | $4,818 | $152,720 | $36,770 | $115,950 |
| 2015 | $4,818 | $152,720 | $36,770 | $115,950 |
| 2014 | $4,720 | $147,260 | $36,760 | $110,500 |
Source: Public Records
Map
Nearby Homes
- 1423 Quinnipiac Ave Unit 808
- 1423 Quinnipiac Ave Unit 709
- 1423 Quinnipiac Ave Unit 108
- 1423 Quinnipiac Ave Unit 602
- 90 Foxon Blvd
- 24 Laura Cir
- 66 John St
- 1445 Quinnipiac Ave
- 173 Russo Ave Unit 409
- 173 Russo Ave Unit 609
- 173 Russo Ave Unit 410
- 5 Assumption St
- 290 Eastern St
- 15 Donna Dr Unit A1
- 40 Donna Dr Unit C2
- 72 Gene St
- 300 Foxon Hill Rd
- 1706 Quinnipiac Ave
- 15 Glen Haven Rd
- 30 Thompson St